The recent pullback in stocks has taken the Dow Jones Industrial Index (DJIA) below the round-number 30,000 level. Even levels, especially on the most popular stock market index, can be a psychological demarcation line. They can mark points at which investors deem the index as either cheap or expensive. Perhaps this changes their outlook for stocks or even their behavior to buy, sell, or hedge.
The chart below shows the Dow with lines at each interval of 5,000. The yellow markers are points at which the index was above one of those levels for at least three months before falling below it on an intraday basis. This is the second signal of the year on the 30,000 level. It’s looking eerily similar to the action around the 25,000 level, in which the Dow broke below, bounced, then broke below a second time relatively quickly. That break was a big one, with the Dow falling by over 25% over the next month before recovering from the coronavirus crash. This week, I’ll look at how the Dow has behaved after breaches of these psychological levels.

Dow After Breaking Even Levels
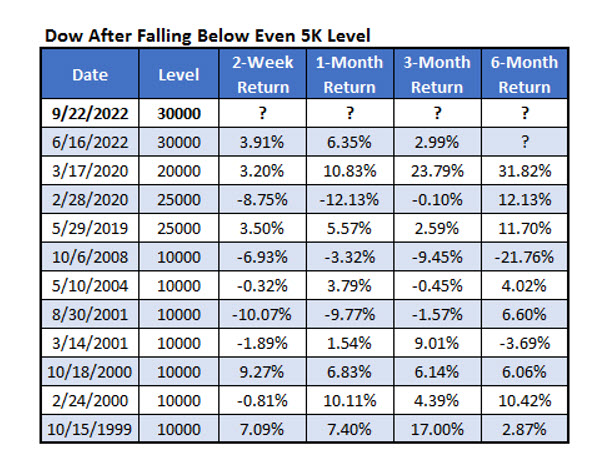
The data in the table below shows how the Dow performed after falling below an even 5,000 level after being above the level for at least three months. I only looked at intervals 10,000 and above. The first signal was in 1999. The second table shows typical Dow returns since then for comparison.
The Dow has struggled immediately after breaching the level. Two weeks out, the blue-chip index averaged a slight loss with over half of the returns negative. After that initial fall, however, the index has been great. Only a month after a signal, the Dow averages a gain of almost 2.5% with 73% of the returns positive. Compare that to the typical one-month return of 0.54% and a 62% chance of being positive.
Six months after a signal, the Dow averaged a return about double the typical return (6.02% vs. 3.09%) and was positive 80% of the time. Perhaps a break of these even levels often elicits climactic selling. For each signal, I found the lowest level the index fell to for each timeframe. The bad news from these signals is that the Dow tends to fall further than normal. While the index averaged a gain of 6% over the next six months, its trough over the next six months averaged a loss of 11%, and the low over a random six-month period was 7.5%.

For those curious, the table below lists each of the signals in which the Dow broke below an even 5,000 level after being above it for at least three months. The 10,000 level was clearly a daunting point as the Dow rose above that level then fell back below it seven times over a span of nine years. Hopefully, nine years from now, we’re no longer discussing the Dow at 30k, but we shall see.

Before you make your next trade, you'll want to hear this.
MarketBeat keeps track of Wall Street's top-rated and best performing research analysts and the stocks they recommend to their clients on a daily basis.
Our team has identified the five stocks that top analysts are quietly whispering to their clients to buy now before the broader market catches on... and none of the big name stocks were on the list.
They believe these five stocks are the five best companies for investors to buy now...
See The Five Stocks Here
Which stocks are likely to thrive in today's challenging market? Click the link below and we'll send you MarketBeat's list of ten stocks that will drive in any economic environment.
Get This Free Report