Ecommerce cloud platform
Shopify Inc. (NASDAQ: SHOP) provides simple, customizable and scalable website set-up and management solutions to generate online sales for products and services. Shopify’s one-stop platform enables set-up, marketing/branding, API integration, transaction/checkout processing, and loan services for over one-million small to medium-sized businesses worldwide while simultaneously expanding its own marketplace. Shopify integrates directly with numerous popular online marketplaces including
Amazon NASDAQ: AMZN ,
Etsy NASDAQ: ETSY ,
Alibaba NASDAQ: BABA and
eBay NASDAQ: EBAY to list, sync and manage inventory and transactions from a single source of truth platform. Shopify faces tons of competition with website integrators like
Wix.com NASDAQ: WIX and hosting services
Verisign NASDAQ: VRSN . Its interface is extremely simple and streamlined, unlike the jumbled mess of tag-on products solicited at checkout like
GoDaddy NASDAQ: GDDY , Shopify represents the era of nimble fin-techs that embody simplicity and functionality with contemporary design. Shares of SHOP have been on fire squeezing to all-time highs of 495 in Feb. 2020, driven by a combination of triple-digit annual top-line growth and the razor-thin 103-million share float perpetuating a nightmarish and sustained short-squeeze, very reminiscent online discount travel platform
Booking Holdings Inc. NASDAQ: PCLN .
Earnings Catalyst
Shopify reports Q4 2019 earnings pre-market on Wednesday, Feb. 12, 2020, followed by the 8:30 am EST conference call. Consensus analyst estimates are for $0.24 EPS on revenues of $482.09 million. Shares propelled upwards on Dec. 19, 2019, when SHOP announced record merchant sales north of $2.9 billion for the Black Friday to Cyber Monday shopping weekend. This brings up the question as to whether all the good news for Q4 has already been priced in heading into the earnings release. Investors will want to see continued international penetration and sustained growth trends confluence with rising retail ecommerce trends. Updates on service enhancements like 3-D modeling, multi-language APIs and Shopify Fulfillment Network enhancements to improve supply chain economics and POS brick and mortar improvements including camera-based inventory search and loyalty program integration apps. Impacts from the coronavirus and signs of margin expansion/deterioration will shape the narrative which drives sentiment moving forward.
Rifle Chart Technical Analysis Trajectories: Longer-Term
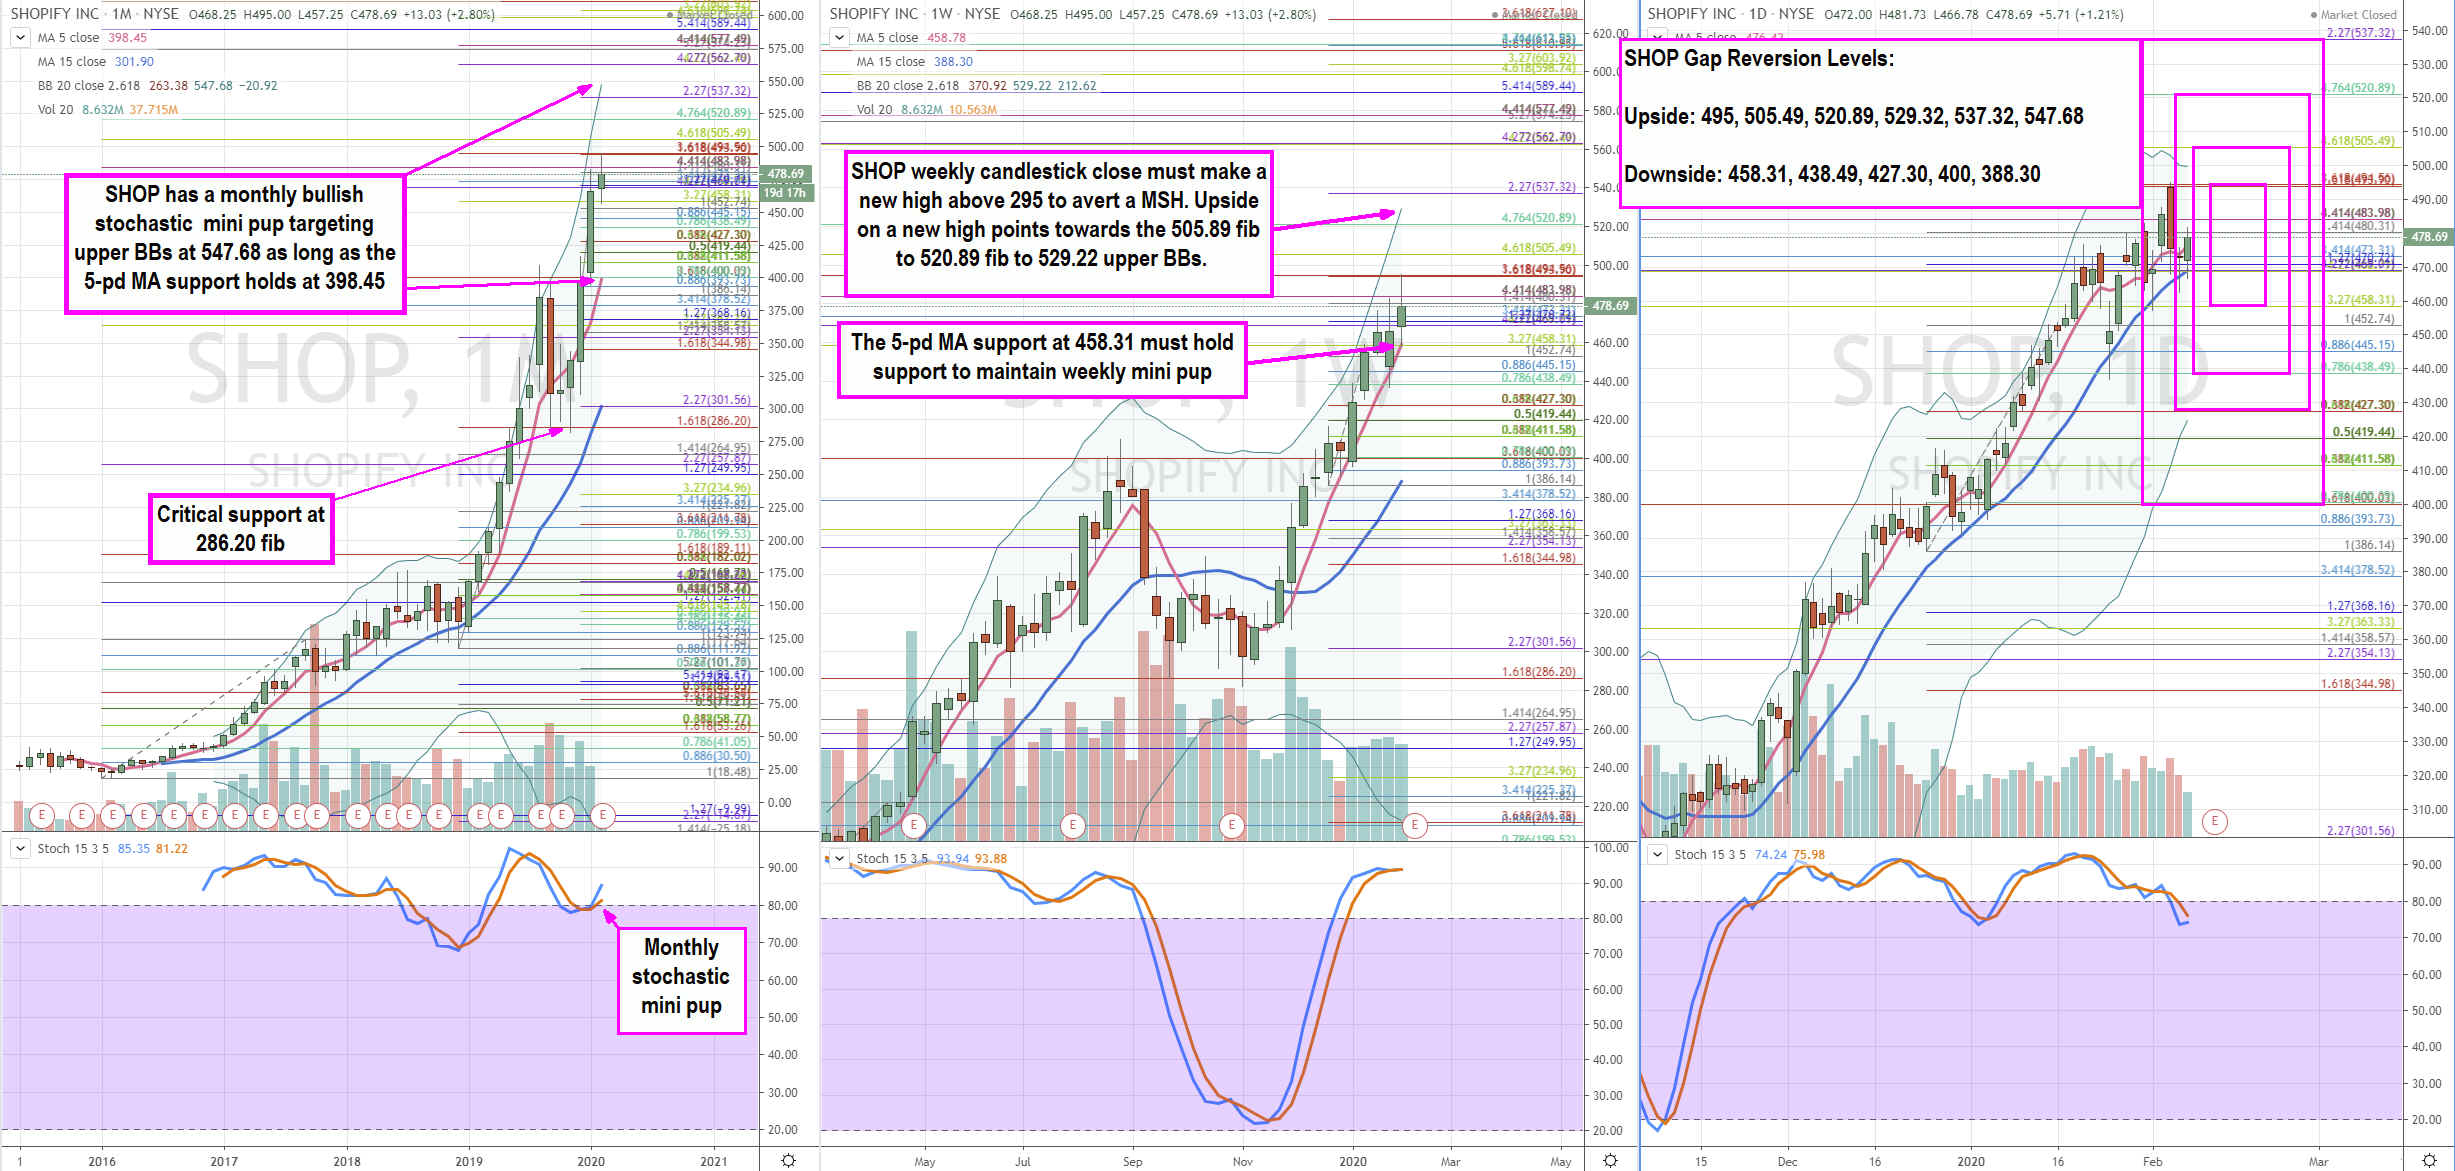
Utilizing the rifle charts on wider time frames suitable for swing traders and investors, SHOP has a bullish stochastic mini pup on the monthly chart with upper Bollinger Bands (BBs) targeting the 547.68. The 5-period moving average (MA) support is at 398.45. If the 5-period MA support holds, then upside BBs are viable price targets longer-term. Should that 5-pd MA break then the 15-period MA support sits at the 301.56 Fibonacci (fib) level with the double-bottom critical support at the 286.20 fib. Keep in mind fibs are static while moving averages are dynamic and change in value with each candlestick close. Therefore, the monthly 5-period MA will change in value when the candle closes on the last day of February.
The weekly candlestick close made a higher high at 495. If the 495 peak doesn’t break this week, then a potential market structure high (MSH) will form on the lower weekly candle high and the sell trigger on the low which usually corresponds with the 5-period MA, currently at 458.31 fib. If the 5-period MA breaks, then a stochastic crossover down to re-test the 80-band can trigger a sell-off to the daily lower BBs at 427.30 fib then 400.03 fib and 393.73 fib ahead of a coil. The 286.20 is the key 1.618 fib support that absorbed both a monthly and weekly bearish stochastic mini inverse pup. This is the critical support level for long-term investors as a great area to add to positions or consider stops on breakdowns under 279. These are wider time frame trajectories to reference throughout the year and more accommodative to swing traders and investors.
Sympathy Stocks:
SHOP shares tend to correlate generally with e-commerce stocks. For trading purposes, WIX tends to carry the most positive correlation both intraday and on wider time frames. BABA also carries a positive correlation in the absence of China-related news. GDDY is the cheapest alternative sympathy stock if SHOP has extensive gaps or grinds beyond 10-percent price moves.
Trading Game Plan: Short-Term
This information is accommodative to intraday and short-term traders. The Feb. 12, 2020 earning release and conference call will take place prior to the 8:00 am EST access times for most retail platforms. SHOP has notoriously wide spreads up several points initially, so it’s best to give it time and room for slippage. High priced momentum stocks can easily overshoot fib levels by several points initially so lightly scaled positions are key. Active traders should focus on trading the gap patterns in the morning session for the best volatility. Reversion scalps off the key price inflections levels can be played for the second gap reaction then shift focus to the third reaction trend move. The gap price reversion levels for the upside gaps are: 495 super fibs/highs, 505.49 fib/sticky 5s zone, 520.89 fib, 529.32 weekly upper BBs, 537.32 fib, 547.68 monthly upper BBs. Downside gap reversion price levels are: 458.31 weekly 5-pd MA/fib, 438.49 fib, 427.30 super fib, 400 monthly 5-pd MA/super fib and 388.30 weekly lower BBs. If SHOP moves beyond 20-period on the gap or grind, then consider sympathy trades on WIX and GDDY.
MarketBeat's analysts have just released their top five short plays for May 2024. Learn which stocks have the most short interest and how to trade them. Click the link below to see which companies made the list.
Get This Free Report