- History shows that a recession is a needed pullback to make the markets pliable for new highs
- The last three recessions occurred in the new millennium
- Historically, recessions last an average of 17 months
The big R word is upon us. A
recession is defined as two consecutive quarters of declining gross domestic product (GDP). By this definition, we are in a recession based on the first quarter 2022 GDP decline of (-1.6%), and second quarter GDP decline of (-0.9%). It’s worth taking a look at previous
recessions in the electronic trading era to alleviate some of the fear of the unknown. Every recession in the U.S. stock market history has resulted in a higher market afterwards. History shows that a recession is a needed pullback to make the markets pliable for new highs. Keep in mind this only applies to the benchmark indexes like the
S&P 500 NYSEARCA: SPY and not to every individual stock. This is because the benchmark indexes regularly swap out underperforming stocks to keep them buoyant and rising long-term. Each recession has resulted the creation of more bagholders that believed the hype and rode their positions all the way down. Not every stock survives a recession or bear market, only the indexes are destined to rally back. Historically, recessions last an average of 17 months. Stock markets also tend to rally prior to the end of each recession. Investors that seek individual stocks can consider taking some of the highest weighted components in the S&P 500 like the top three including
Apple NASDAQ: AAPL,
Microsoft NASDAQ: MSFT, and
Amazon NASDAQ: AMZN as these stocks tend to
lead the index movements on the way up (and down).
History of Three Recent Recessions
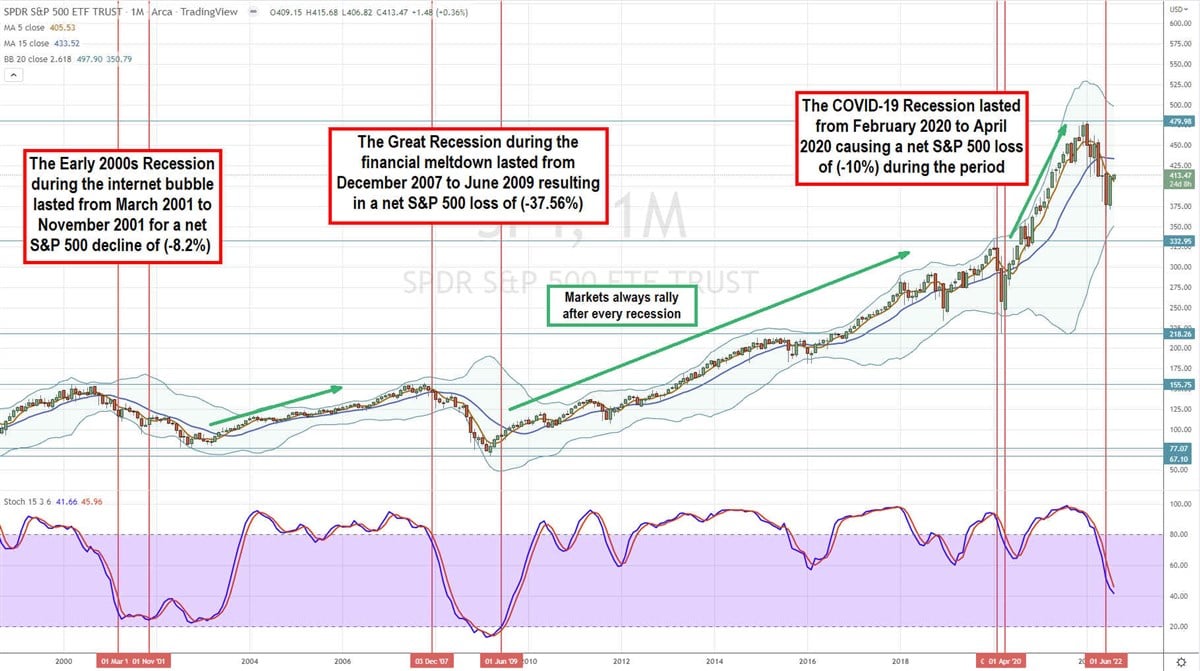
The last three recessions occurred in the new millennium. The Early 2000s recession occurred during the internet bubble and subsequent bear market as the S&P 500 NYSEARCA: SPY fell (-26.3%) from its highest point at $155.75 to round out the loss at (-8.2%) by the end of November 2021. The SPY continued to sell-off for the next 11 months until making its lows of $77.07 by October 2002. The SPY managed to rally back towards the $155.75 previous highs during the real estate bubble by June 2007. Unfortunately, the SPY plunged into the next recession in December 2007. The Great Recession saw the financial meltdown trigger a sell-off of (-55.47%) to $67.10 from the SPY highest point of $155.75 to close out (-37.56%) during the 16 month period ending June 2009. Markets managed to recover as the SPY broke through the prior high and double top of $155.75 in March of 2013 and continue to hit all-time highs of $332.95 by January 2020 at the dawn of the COVID-19 pandemic triggering the most recent recession. The COVID-19 recession lasted two months as the SPY fell (-33.9%) to a low of $218.26 before bouncing to close out a (-10%) decline by April 2020. The markets would stage a slingshot rally that broke back up through the highs of $332.95 by August of 2020 and continue to surge to new all-time highs of $479.98 by January 2022 before falling again into the current recession of 2022. The SPY has hit a high of $479.98 in January 2022 and fell (-24.5%) to a low of $362.17 by June 2022 before staging a rally in August. For the last three recessions the SPY has fallen (-26.3%), (-55.47%), and (-33.9%) from its highs to lows. This current recession has seen a (-24.5%) drop from high to lows assuming the lows are held.
Using Rifle Charts to Spot the End of the Recession
Using the rifle charts on a monthly basis, we can see that each recession recovery was preceded by the stochastic cross back up, a rising 5-period moving average (MA) support and a monthly market structure low (MSL) buy trigger. The 2001 recovery started on a 25-band cross up. The 2009 recovery started on a 20 band cross up. The 2020 recovery started on a 70-band cross up. While a low band cross up through or off the 20-band is preferred, the COVID-19 recovery triggers on the 70-band cross up. All three reversals occurred after the monthly stochastic has crossed back up. Currently the monthly stochastic is still falling at the 40-band but has gotten back above the monthly 5-period MA at $405.53. The monthly MSL trigger will be determined by the SPY’s highest price in August 2022. If the SPY can break through August’s highs while the 5-period MA support rises or crosses over the 15-period MA and the stochastic crosses back up, then we are out of the proverbial woods. This will take at least two months or two monthly candles to confirm, assuming the SPY doesn’t break the swing low of $362.17. The market usually recovers before the end of the recession. However, it is certainly possible for markets to continue lower even after the recession as illustrated by the Early 2000s recession. The caveat was the unprecedented 911 World Trade Center terrorist attack causing markets to sell-off lower until the U.S. launched its war in Afghanistan in 2002. The most recent two recessions saw the stock market bottom first and didn’t look back afterwards.
Before you consider SPDR S&P 500 ETF Trust, you'll want to hear this.
MarketBeat keeps track of Wall Street's top-rated and best performing research analysts and the stocks they recommend to their clients on a daily basis. MarketBeat has identified the five stocks that top analysts are quietly whispering to their clients to buy now before the broader market catches on... and SPDR S&P 500 ETF Trust wasn't on the list.
While SPDR S&P 500 ETF Trust currently has a "hold" rating among analysts, top-rated analysts believe these five stocks are better buys.
View The Five Stocks Here
As the AI market heats up, investors who have a vision for artificial intelligence have the potential to see real returns. Learn about the industry as a whole as well as seven companies that are getting work done with the power of AI.
Get This Free Report