S&P 500 5,061.82
DOW 37,735.11
QQQ 431.06
3 Energy Plays for Cash Flow: Buy 1 or Buy Them All
M&T Bank, Goldman Sachs rise; Salesforce, Tesla fall, Monday, 4/15/2024
When Will the Next Bull Market Be?
The Charles Schwab Company Can Hit New Highs
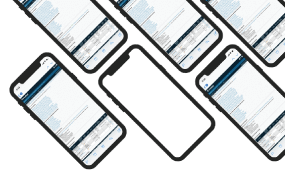
Global smartphone shipments climb nearly 8% in 1st quarter as Samsung retakes the lead
Closing prices for crude oil, gold and other commodities
Kinder Morgan Stock Bid Up In An Oil Breakout
S&P 500 5,061.82
DOW 37,735.11
QQQ 431.06
3 Energy Plays for Cash Flow: Buy 1 or Buy Them All
M&T Bank, Goldman Sachs rise; Salesforce, Tesla fall, Monday, 4/15/2024
When Will the Next Bull Market Be?
The Charles Schwab Company Can Hit New Highs
Global smartphone shipments climb nearly 8% in 1st quarter as Samsung retakes the lead
Closing prices for crude oil, gold and other commodities
Kinder Morgan Stock Bid Up In An Oil Breakout
Sign in to your free account to enjoy these benefits
- In-depth profiles and analysis for 20,000 public companies.
- Real-time analyst ratings, insider transactions, earnings data, and more.
- Our daily ratings and market update email newsletter.
Sign in to your free account to enjoy all that MarketBeat has to offer.
or
By creating a free account, you agree to our terms of service. This site is protected by reCAPTCHA and the Google Privacy Policy and Terms of Service apply.