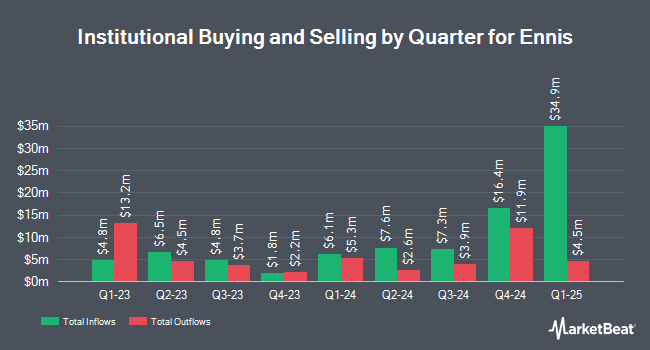
Nuveen Asset Management LLC decreased its holdings in Ennis, Inc. (NYSE:EBF - Free Report) by 30.4% during the fourth quarter, according to the company in its most recent disclosure with the Securities & Exchange Commission. The firm owned 209,752 shares of the industrial products company's stock after selling 91,750 shares during the period. Nuveen Asset Management LLC owned about 0.81% of Ennis worth $4,424,000 as of its most recent filing with the Securities & Exchange Commission.
A number of other hedge funds and other institutional investors have also bought and sold shares of EBF. Quantbot Technologies LP purchased a new stake in Ennis in the fourth quarter worth $65,000. SG Americas Securities LLC increased its stake in Ennis by 46.0% in the fourth quarter. SG Americas Securities LLC now owns 6,194 shares of the industrial products company's stock worth $131,000 after purchasing an additional 1,951 shares during the period. GPS Wealth Strategies Group LLC increased its stake in Ennis by 10.3% in the fourth quarter. GPS Wealth Strategies Group LLC now owns 7,099 shares of the industrial products company's stock worth $150,000 after purchasing an additional 663 shares during the period. Bridgeway Capital Management LLC purchased a new stake in Ennis in the fourth quarter worth $209,000. Finally, Ieq Capital LLC purchased a new stake in Ennis in the fourth quarter worth $217,000. Hedge funds and other institutional investors own 74.33% of the company's stock.
Insider Transactions at Ennis
In other news, Director Michael J. Schaefer sold 2,000 shares of the stock in a transaction on Friday, May 2nd. The stock was sold at an average price of $17.86, for a total transaction of $35,720.00. Following the transaction, the director now owns 30,747 shares of the company's stock, valued at approximately $549,141.42. This represents a 6.11% decrease in their position. The transaction was disclosed in a filing with the Securities & Exchange Commission, which can be accessed through this link. In the last 90 days, insiders have sold 19,873 shares of company stock valued at $357,330. 3.50% of the stock is currently owned by corporate insiders.
Ennis Stock Performance
EBF stock traded down $0.15 during midday trading on Wednesday, reaching $18.50. The company's stock had a trading volume of 126,855 shares, compared to its average volume of 155,940. Ennis, Inc. has a 1 year low of $17.15 and a 1 year high of $25.75. The stock has a fifty day simple moving average of $18.83 and a two-hundred day simple moving average of $20.19. The firm has a market capitalization of $481.98 million, a price-to-earnings ratio of 11.64 and a beta of 0.46.
Ennis (NYSE:EBF - Get Free Report) last posted its quarterly earnings results on Monday, April 21st. The industrial products company reported $0.35 earnings per share (EPS) for the quarter, missing analysts' consensus estimates of $0.37 by ($0.02). Ennis had a return on equity of 12.16% and a net margin of 10.35%. The firm had revenue of $92.70 million for the quarter, compared to the consensus estimate of $95.60 million.
Ennis Dividend Announcement
The company also recently declared a quarterly dividend, which was paid on Monday, May 5th. Stockholders of record on Monday, April 14th were given a dividend of $0.25 per share. This represents a $1.00 dividend on an annualized basis and a dividend yield of 5.41%. The ex-dividend date was Monday, April 14th. Ennis's payout ratio is 64.52%.
Analysts Set New Price Targets
Separately, Wall Street Zen lowered Ennis from a "strong-buy" rating to a "buy" rating in a research note on Tuesday, April 22nd.
Read Our Latest Research Report on Ennis
About Ennis
(
Free Report)
Ennis, Inc manufactures and sells business forms and other business products in the United States. The company offers snap sets, continuous forms, laser cut sheets, tags, labels, envelopes, integrated products, jumbo rolls, and pressure sensitive products under the Ennis, Royal Business Forms, Block Graphics, 360º Custom Labels, ColorWorx, Enfusion, Uncompromised Check Solutions, VersaSeal, Ad Concepts, FormSource Limited, Star Award Ribbon Company, Witt Printing, B&D Litho, Genforms, PrintGraphics, Calibrated Forms, PrintXcel, Printegra, Forms Manufacturers, Mutual Graphics, TRI-C Business Forms, Major Business Systems, Independent Printing, Hoosier Data Forms, Hayes Graphics, Wright Business Graphics, Wright 360, Integrated Print & Graphics, the Flesh Company, Impressions Direct, and AmeriPrint brands.
See Also
Before you consider Ennis, you'll want to hear this.
MarketBeat keeps track of Wall Street's top-rated and best performing research analysts and the stocks they recommend to their clients on a daily basis. MarketBeat has identified the five stocks that top analysts are quietly whispering to their clients to buy now before the broader market catches on... and Ennis wasn't on the list.
While Ennis currently has a Hold rating among analysts, top-rated analysts believe these five stocks are better buys.
View The Five Stocks Here
Looking to profit from the electric vehicle mega-trend? Enter your email address and we'll send you our list of which EV stocks show the most long-term potential.
Get This Free Report
Like this article? Share it with a colleague.
Link copied to clipboard.
