This article will explore how breakouts occur to form breakout stocks. We’ll learn the techniques used to find breakout stocks. We'll also review some of the more popular breakout stock patterns. By the end of this article, you will thoroughly understand breakout stocks and how they can affect your trades.
What is a Breakout in the Stock Market?
A breakout is a technical analysis term describing when a stock rises through and above a price resistance level and continues to uptrend higher. Resistance is a price level that sellers sell into, causing the stock to deflect back down.
Resistance levels are a price ceiling with too much supply as demand thins out, causing the stock to fall back to a support level. A support level is a price point where buyers are ready and willing to buy. It's a price level where demand is steady enough to absorb the selling. These are absorbing levels where resistance absorbs buyers and deflects them down, and support absorbs sellers to deflect them up.
Breakouts tend to attract more buyers as shares continue to rise. A stock can trade in a defined obvious range for a duration of time, but when it starts to rise through the top of that range on elevated volume, it can form a breakout. An uptrend follows a breakout that raises the stock price by making higher highs on bounces and higher lows on pullbacks.
Why Do Stocks Break Out of a Range?
Stocks break out when demand outstrips supply. Like a tidal wave, buyers overwhelm sellers at the resistance level, causing them to raise their prices. This causes buyers aggressively buy more shares as fear of missing out (FOMO) kicks in. As prices increase, short sellers start to cover their positions to trim losses, adding more buying pressure. Buyers on the fence when the stock is in a range become more motivated to step in and buy before the prices increase. This sequence repeats as the stock makes higher highs and higher lows.
There are many reasons for demand to soar, driving up buying pressure and causing stocks to break out of range. These reasons tend to general positive sentiment. They can range from earnings beats, guidance raises, analyst upgrades, legal outcomes, Federal Drug Administration (FDA) approvals, positive clinical trials, takeover offers and rumors, product launches and events.
A sector or industry may have exceptional strength as a leader’s stock jumps on some catalyst. This can pull up the rest of the stocks in the particular industry. Traders like to play laggards when a leading stock breaks out.
Stock Breakout Patterns
Stock breakouts form from familiar repeating chart patterns. Here are three of the most common stock breakout patterns to be aware of.
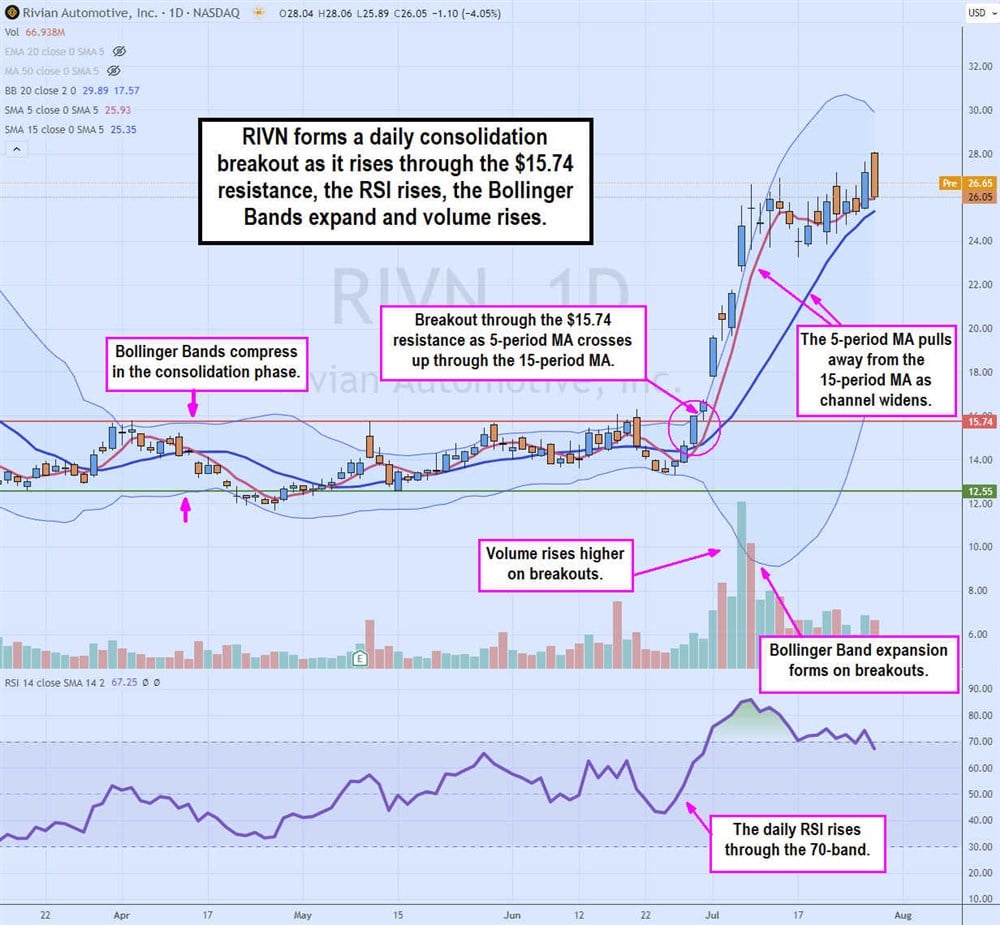
Consolidation Breakout
This typical breakout triggers after an extended period of choppy consolidation within a trading range. Preceding the breakout, Bollinger Bands compress as volume remains relatively light. The resistance price level is well-defined. The breakout forms when the price rises through the resistance level. The momentum indicator, like the relative strength index (RSI), should rise again. The moving averages should have a crossover with the shorter time frame, like a five-period moving average should crossover through the 15-period moving average. As the breakout accelerates, the volume rises as Bollinger Bands expands. The channel between the fivxe-period moving average and the 15-period moving average expands as the five-period moving average peels higher.
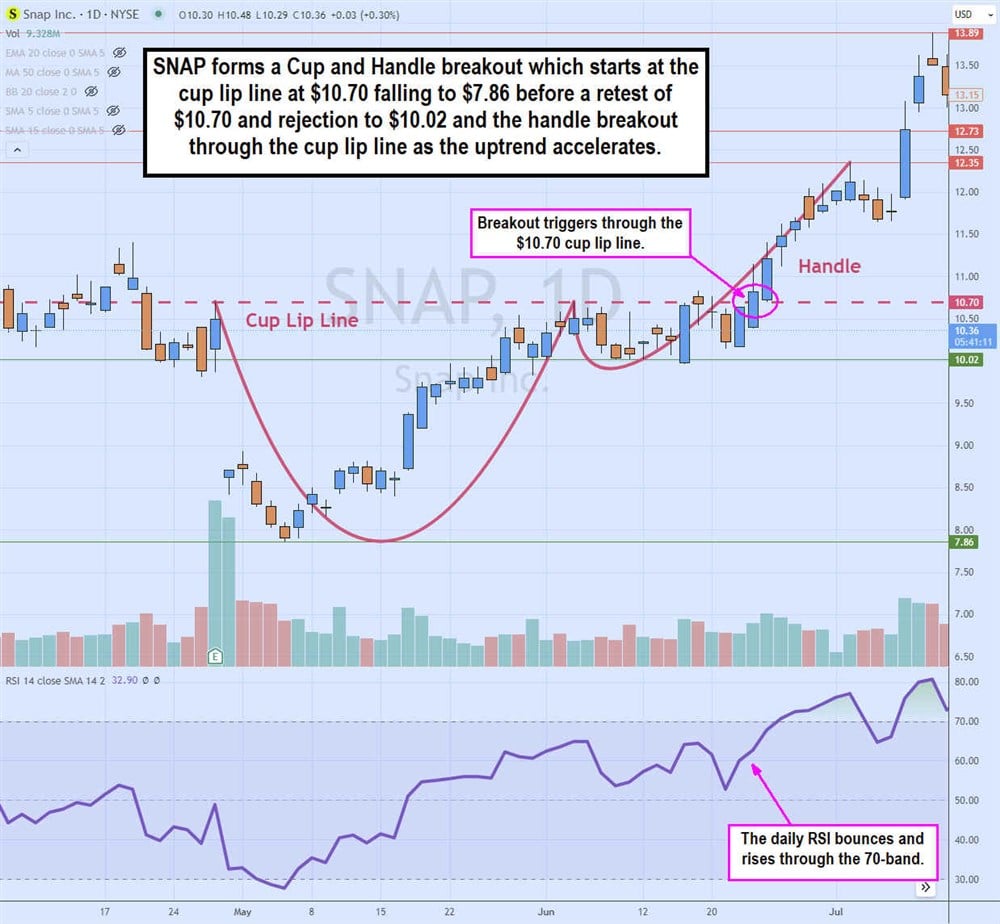
Cup and Handle Breakout
A cup and handle breakout consists of two parts. The first part is the cup. The cup starts to form at a peak before it descends to an extended low. The stock starts to form a rounding bottom as it recovers back to the cup lip line, where it gets rejected. The cup lip line is a resistance. The pullback from the cup lip line is shallow as the stock bottoms and bounces back up, forming the second part of the formation, the handle. As shares rise towards the cup lip line resistance again, it triggers the breakout as shares rise through the cup lip line as the handle continues its extension. An uptrend proceeds the breakout as the handle gets longer above the lip line.
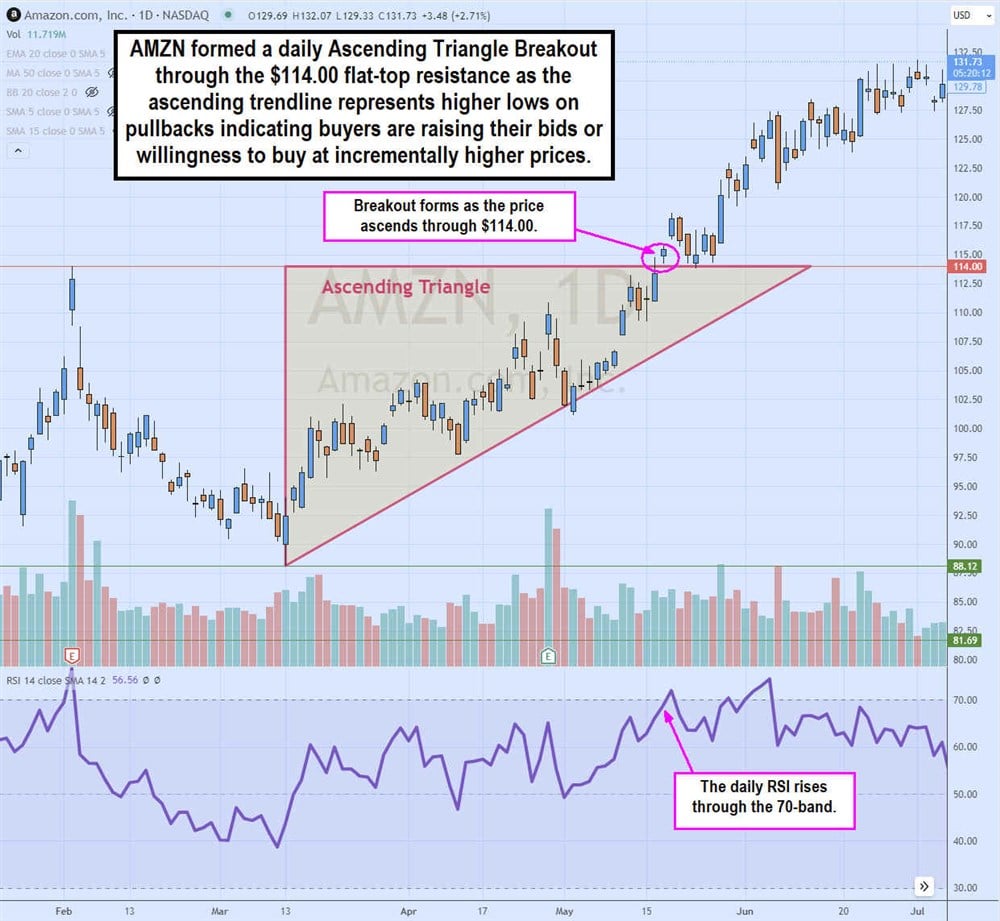
Ascending Triangle Breakout
The ascending triangle breakout comprises a flat-top resistance horizontal trendline and an ascending diagonal rising trendline. They meet at the apex point, forming the triangle. The triangle commences with a horizontal trendline representing a flat-top resistance. The ascending trendline starts from a swing low. The resistance rejects breakout attempts, but each pullback becomes more shallow, making higher lows until it gets closer to the apex point and eventually breaks out through the flat-top resistance.
How to Spot Breakouts
Here is a five-step process for spotting breakouts, including how to find breakout stocks in swing trading. You will initially set up the first step but continue using it until you adjust your indicators and settings.
Step 1: Prepare chart indicators.
While it is possible to eyeball a stock breakout just by looking at the candlestick charts, it's much easier to use indicators that can provide more insights and confirmation. It helps to have both price indicators and momentum indicators. However, don't crowd the chart with too many breakout indicators.
In our example, we have three price indicators and one momentum indicator. The price indicators are the 50-period simple moving average (purple), Bollinger Bands (blue lines) and a Cup and Handle pattern. We used the relative strength index (RSI) as our momentum indicator.
Step 2: Select stock(s) to analyze.
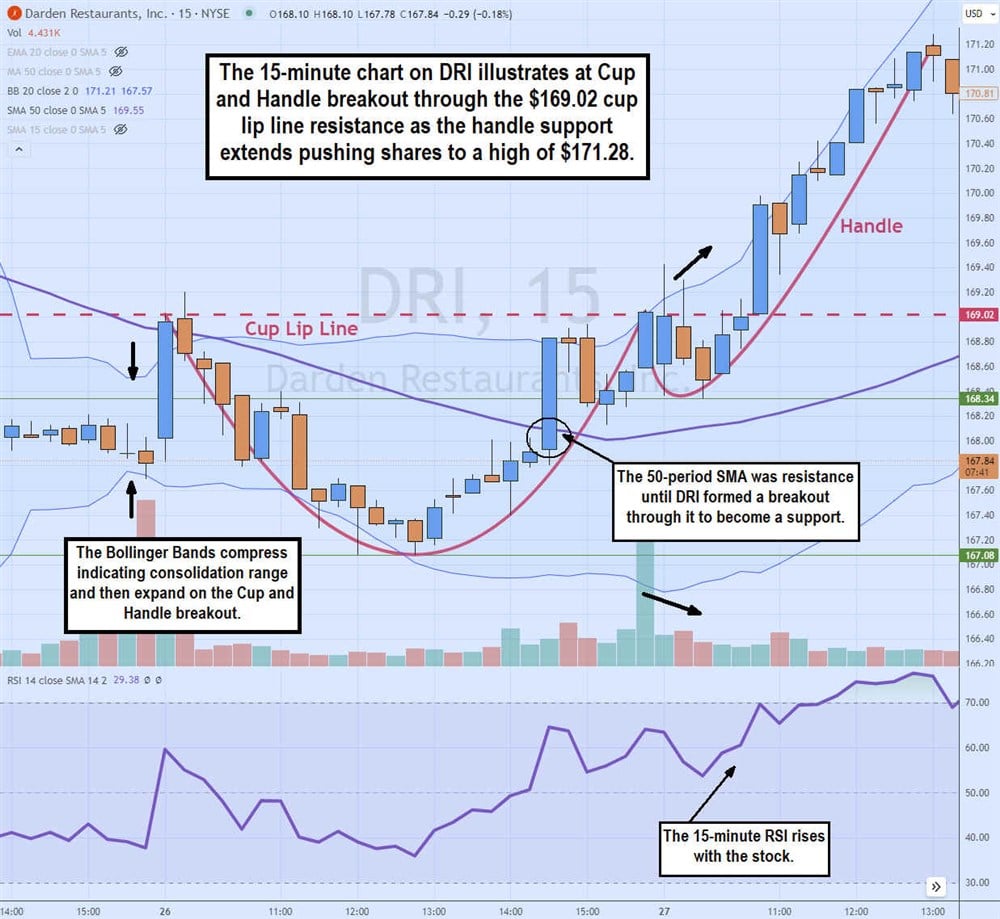
When learning to spot breakouts, it helps to start analyzing stocks you are familiar with before moving on to new stocks. In our example, we chose Darden Restaurant Inc. (NYSE: DRI) on an intraday 15-minute chart. DRI is the nation’s largest restaurant chain of familiar brands like Olive Garden, Texas Roadhouse, Capital Grille and Ruth’s Chris Steakhouse.
Step 3: Identify support and resistance price levels.
We used a 50-period simple moving average (SMA) as our trend indicator. DRI starts to form the cup lip line at $169.02 as it falls below the 50-period SMA selling off to a low of $167.08. When DRI is trading underneath, then the 50-period SMA is a resistance.
As DRI forms a rounding bottom and stages a rally powered by the rise of the RSI from the 40-band, we can see it breakout through the 50-period MA at $168.08 on a big green candle. DRI retests the $169.02 cup lip line resistance but fails to hold above it as it falls back to $168.34 support.
Step 4: Watch for the breakout signal.
DRI stages another bounce from the $168.34 price level powered by the RSI bouncing up towards the 70-band. The Bollinger bands are also starting to expand, indicating a price expansion and potential breakout is forming.
Step 5: Confirm the breakout.
The breakout triggers when shares spike through the $169.02 as the handle extends higher as DRI rises to $171.28 before forming a peak. The Bollinger band expansion, the RSI rise and the rising handle support confirm the DRI breakout. As long as it stays above the lip line and the handle rises, the breakout and uptrend are in effect. The 15-minute cup and handle breakout triggered the $169.02 break, rising to $171.28 for a $2.06 upside move.
Pros and Cons of Breakout Stocks
Breakouts are not always perfect. There are pros and cons with breakout stocks.
Pros
A breakout stock has many upside advantages:
- Upside profit potential: Breakouts are the start of a new uptrend. If timed well, a breakout stock can lead to a profitable trade if you get in at the breakout point. In the DRI example of the 15-minute cup and handle pattern, the breakout netted a potential profit of $2.06.
- Clear entry and exit levels: Breakouts can provide clear entry triggers when the resistance level breaks. Resistance levels convert to support levels after a breakout.
- Common patterns: Breakout patterns are not rare but rather common. They are also linear and can form in any time frame. When a leading stock in a sector or industry breaks out, it often pulls up the peer stocks and competitors.
Cons
There are downsides to learning how to find breakout stocks:
- Chasing entries too high: Breakout signals often come at the high of the range or quickly rising prices. Breakouts cost more since there is momentum and strong buying demand. This can often cause traders and investors to chase an entry too high, fueled by the fear of missing out (FOMO). Waiting for a confirmation on the breakout when it rises without any pullbacks can get expensive, drawing you in at the top, which can be detrimental, getting in at the top as it reverses.
- False breakouts: To get in early on the breakout, many traders will step in when a resistance level overshoots. The breakout often won't get confirmation and can fall right back under the resistance level. If too many people get sucked into the false breakout, the stock can reverse back down, causing a panic sell-off.
- Active management: Catching breakout stocks takes an active management approach. You will have to watch the screens, waiting for your entry. There is usually a small window of opportunity to get into a breakout at the earliest confirmation before it gets too expensive, but you must watch for it.
Tips for Handling Breakout Stocks
Here are some tips for handling a breakout stock.
Breakout Stocks with High Volume
The conventional thinking is that stocks need high volume to break out. While it may be true, depending on the time frames, stocks and the market can break out and climb on relatively low volumes. It's important to watch the volume bars for stocks that break out on high volume. Breakouts can't sustain the high volume forever. It's common to see breakouts peak as volume starts to fall back to normal.
Penny Stock Breakouts
Penny stock breakouts can be tricky. If they are usually low-volume stocks, then be careful not to chase a breakout, especially if there's a day when the volume is 10x more than normal. With penny stocks, there's always the risk of it being a pump-and-dump manipulated breakout. These breakouts often suck in beginners and desperate traders in a game of musical chairs. Unfortunately, the stock and volume fall back down when the music stops. Be critical when you are watching penny stocks ready to break out.
Shorting Downside Breakouts
Just as you can go long on a breakout, you can go short on a breakdown, a downside breakout. Short selling is risky, so be aware of the potential for a margin call and forced liquidation. Be aware of your maintenance margin levels and stay within them. Also, have a stop-loss and take your losses early before they get too large.
Breakout or Wiggle?
Breakouts look obvious after they occur. However, spotting them as they form can be tricky. What is the difference between a breakout and a wiggle? It's the same concept when contemplating the difference between a "hero" and a "coward?" The hero and coward start in the same boat, but the hero holds their ground while the coward runs away.
You can say the same about the difference between a breakout and a wiggle. They start the same, with the stock initially rising through the resistance level, but a wiggle lacks the follow-through and falls back into the trading range. A breakout also starts as the price ascends through the resistance level but continues to increase as buyers absorb pullbacks. This is why "Step 5: Confirm the breakout" is so relevant in our five-step process for spotting breakouts. Always confirm the breakout before making a trade.
FAQs
Here are some answers to frequently asked questions.
What is a breakout in stocks?
A breakout occurs when a stock price rises through a resistance level to form an uptrend. The uptrend should continue to rise as prices make higher highs on bounces and higher lows on pullbacks. A breakout is the beginning of the next leg up for a stock. Using moving averages and a momentum oscillator on your stock charts, you can visualize the breakouts.
Which stocks give breakouts?
Stocks with overwhelming demand drive prices higher as dwindling supply results in breakouts. As buyers chase the supply, sellers raise their asking prices. Volume often rises during breakouts, but not all the time.
How to find breakouts in stocks for day trading?
Finding stocks ready to breakout intraday can be quick or thorough, depending on your route. You can find stocks ready for breakout for intraday by monitoring a basket of stocks throughout the day if you have the time and patience. They are easier to find when a general market breakout occurs, which can be observed using the benchmark index ETFs.
Another way is to use a real-time intraday breakout stock screener that will alert you to stocks that are breaking out. It’s always important to avoid impulse trading or chasing entries when you receive alerts or a breakout list. These screeners or scanners are great for finding stocks breaking out today. You can also watch the new high of the day list to find stocks poised for breakout or breakout stocks to buy now. Some screeners will specifically find patterns like cup and handles.
Stocks that make new highs tend to be in a breakout or uptrend. If you’re wondering how to find breakout stock in swing trading, it’s the same routine but with wider time frames since swing trading requires holding for at least a day overnight.