A "gap up" occurs when the opening price of a stock is significantly higher than the prior day’s closing price. An unexpected news event, such as a positive earnings report usually cause this. It usually suggests that investors feel optimistic and buy enthusiastically, though this isn't always the case.
In this article, we’ll break down gap-up stocks by defining what they are and how to identify them. We’ll also provide an overview of gaps so you can understand how to interpret a stock chart and go over the most common gap trading strategies.
What Does Gap Mean?
We can divide gap types into two categories: full and partial.
A full gap occurs when the price moves up or down in a single trading session, leaving no overlap between the day’s close and open prices. Partial gaps involve overlap between two trading days, typically caused by an overnight gap that partially fills during regular market hours.
As for how to find gap up stocks, you can find them at any time. However, they are particularly common during earnings season when top line and/or earnings per share numbers beat analysts’ expectations and cause a stock to surge.
An online gap up stocks screener offers an easy way to identify and track gap-up stocks and can enable you to know how to find stocks before they gap up.
Gap Up Stocks
What does gap up mean in stocks? A gap-up stock opens trading higher than the previous day’s closing price, which means a sharp move with no other trading occurring before or after the gap. You can identify gap-up stocks after hours and stocks gapping up pre-market. The gapping up stock meaning may include the release of news about the stock, such as a good earnings report or some geopolitical event that may incite speculators to bid up the price of the stock.
What does gap up mean in stock trading? Gap up stocks meaning is a significant stock trading opportunity for you. However, you need discipline to follow the trend and set trailing stops that allow you to exit the trade when the direction of the stock no longer supports that trend.
Gap Down Stocks
Gap-down stock is the opposite of a gap-up stock, which happens when trading in a particular asset opens significantly lower than the previous day’s closing price.
Like a gap up, it's usually caused by unexpected events, such as an analyst downgrade or abrupt, concerning news about the company. The opening of exchanges may also cause stocks to gap down if investors are surprised by new developments since markets closed yesterday and don't want to own the security any longer, leading them to sell it off en masse. Then you may find stocks gapping up premarket.
Common Gaps
Common gaps are neither full nor partial gaps, but they still play an important role in stock analysis. Common gaps are areas on a chart where the price has gapped away from its previous level, but there is no discernible pattern for the gap. This could be due to an unexpected news event or a sudden shift in investor sentiment. Common gaps often don't last long; they quickly reverse as traders react to news or changing sentiment around the security. That's why you must closely monitor your position if you're considering entering or exiting trades based on common gap signals.
Breakaway Gaps
These gaps take place at the end of a pricing pattern and signal the start of a new trend. A breakaway gap will typically coincide with high volume since it shows strong buying or selling pressure that breaks away from the previous price range. Most breakaway gaps tend to be upward, but they can be downward, too.
Continuation Gaps
Continuation gaps occur in the middle of a price pattern and signal a rush of buyers or sellers who share a common belief in the underlying stock’s future direction. This type of gap often indicates that the current trend is likely to continue, although not always. Like breakaway gaps, most continuation gaps tend to be upward, but they can also be downward.
When continuation gaps form on a chart, pay attention to volume levels, as this will help confirm whether or not the gap is truly significant or simply noise caused by market fluctuations. If volume spikes during the gap period, it usually signals further strength and the possibility of an extended trend.
Exhaustion Gaps
These gaps occur towards the end of a pricing pattern and represent a final attempt to set a new high or low. Exhaustion gaps will coincide with low volume as buyers and sellers become exhausted from attempting to push the price further. This type of gap indicates that the current trend is likely nearing an end, so keep an eye on your positions to avoid getting caught in a reversal.
Exhaustion gaps can be upward or downward, but up-gaps are more common since they usually occur following uptrends where investors try to push prices higher before the move runs out of steam. Downward exhaustion gaps often signify a long downtrend ending, which can provide an opportunity to enter a long position as prices reverse.
What is a Gap Fill?
A gap fill is attempting to sell or buy a security to close gaps between two prices. In other words, it’s an attempt at trading directly from one price point back up (or down) towards its original closing price when it opened. Gap fills are usually performed by traders looking for quick profits — especially after large news events or announcements that cause gaps in the market — and they can provide an opportunity for arbitrage if done correctly.
How to Play Gap-Up Stocks
As an investment strategy, trading gaps involve stocks that have above-average volatility. This also means it entails above-average risk. However, you can still trade gaps successfully (and profitably). Here are some guidelines that can help you avoid poor gap-up stock trades.
- If a stock gap up has started to fill, it will almost always continue in that direction. This is because the stock has no immediate support and resistance.
- Be sure you understand the type of gap you're trading. An exhaustion gap and a continuation gap move in opposite directions.
- Before you take a position, be sure that the stock price has started to break in the direction you foresee. Individual investors are the ones who tend to get overly enthusiastic about a stock. This plays into the hands of institutional investors who may support the trend to boost their portfolios.
- The volume should be consistent with the kind of gap you're trading.
Once you're familiar with the mechanics of stocks gapping up and understand how to look for potential gap trading opportunities, it’s time to look at some common gap trading strategies. These involve having clear rules for entering and exiting a trade. Gap trading can be risky and having the discipline to follow entry and exit points is one way to help minimize that risk.
Example of a Gap Up Trading Strategy
When it comes to playing gaps in stocks, there are several strategies you can use to make money. One strategy involves buying right after the stock gapping up occurs and selling once prices start to level out or go back down to normal levels. This approach is more risky, however, as it requires you to time the market perfectly and be able to quickly identify when prices will begin leveling off or declining again.
Another option is to buy gap up stocks today and hold onto them for longer periods to take advantage of momentum-based moves or capture any sustained increase in a stock’s price over time. This strategy requires greater patience and while it may provide slower returns initially, it could lead to bigger gains over time if done correctly.
Finally, you may also choose to short-sell gaps if you believe that prices won’t stay high for long due to underlying fundamentals or overall market sentiment about a particular company or sector. Shorting entails borrowing shares from someone else (usually an institution) and then selling them when prices fall afterward to book profits from the decline in value.
Each gap-up strategy has a short and a long trading signal. Most gap-up trading occurs one hour after the market opens to allow time for the stock price to settle into a range.
No matter what strategy you use, be sure to set trailing stops that provide a point where you exit the trade in case the trade starts moving in the opposite direction. For example, if you buy a stock at $50, you could set a trailing stop of 5 percent, in this case $47.50. If the stock rises to $60, you raise the stop to $55.50 (5% of $60) and keep raising it while the price rises. The opposite would occur if you're trying to short the same stock at $50. In this case, you would set a trailing stop at $53.50. If the price drops to $40, you would reset the stop at $42. Trailing stops will usually be tighter (smaller) for partial gap stocks instead of full gap stocks.
For example, on Friday, September 1, shares of automated supply-chain solutions company Ranpak Holdings Corp. (NYSE: PACK) gapped up before trading on Thursday, August 31, after Ranpak insider trades resulted in the purchase of additional shares in the company.
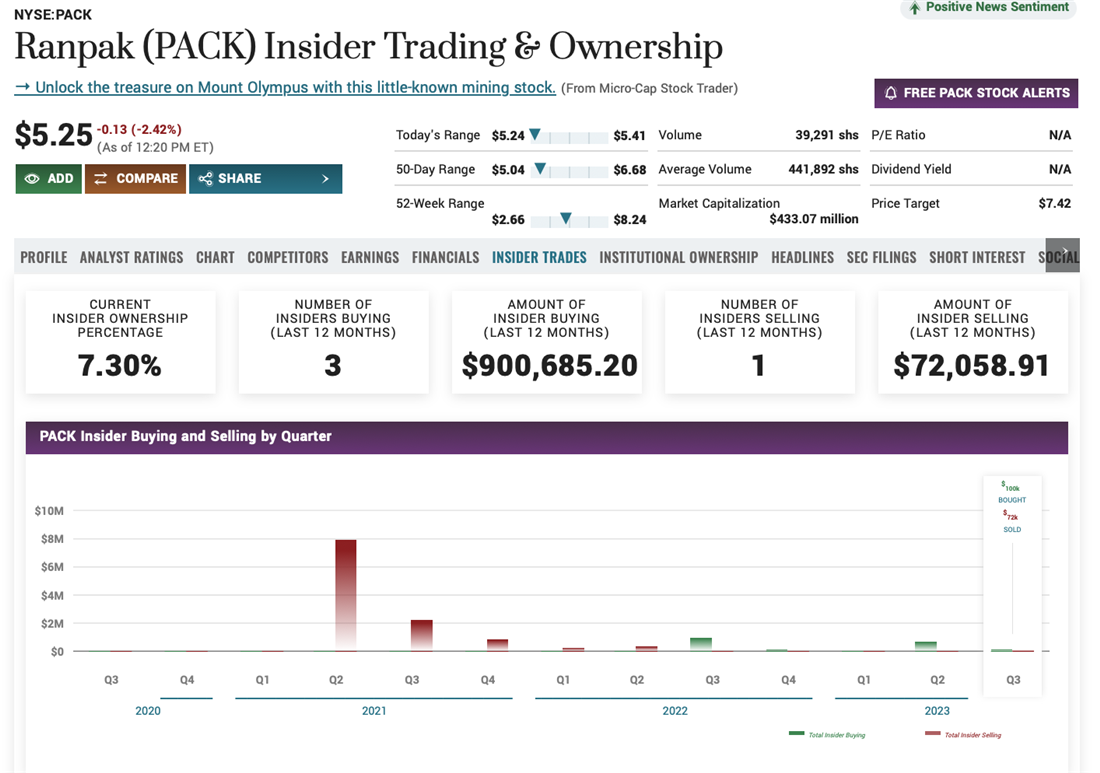
The stock had previously closed at $5.91 but opened at $6.05, subsequently rising to $6.22.
To play the gap on this stock, you would need to analyze the type of gap and the volume of the stock. You may consider buying and holding onto the stock if it's a continuation gap. However, you may consider short-selling the stock if it's an exhaustion gap. To figure out which option is best, be sure to take note of any news or announcements that may affect the stock's price movement.
If you decided to go long on Ranpak Holdings Corp., you could set a trailing stop of 5 percent and monitor the price movement closely. If the Ranpak chart shows the price continues to rise, you could continue raising the stop to protect your profits. On the other hand, if you decide to short-sell the stock, you could set a trailing stop and keep a close eye on the stock in case the price drops and you need to reset it.
Do Gap Trading Strategies Work?
Many investors engage in momentum trading. To these investors, “trading the gap” (also called “gapping up stocks”) isn't logical. After all, what goes up must come down — and usually hard. They reason that if a stock gaps up, it’s due for a correction.
This thinking can be true for stocks with weak fundamentals, or when the market is trending down. In those cases, gap-up stocks rarely stay at those levels, no matter how strong the lift. However, that thinking can work against investors.
For example, in a bullish market, a stock with strong fundamentals may gap after a strong earnings report. When institutional investors learn about the bullish report, they may increase the price. As a trader, if you stay away from the stock, believing that momentum is working against you, you may miss out on significant gains.
The Ups and Downs of Playing the Gap
One of the easiest ways to trade stocks, especially as a day trader, is to look for gap-up stocks. Trading gap-up stocks requires a disciplined system requiring trailing stops at well-defined entry and exit points to limit loss and protect profits.
Of course, not every gap stop is ideal for trading. Pay attention to other technical indicators, such as trading volume, to decide whether or not a stock may produce profits for you.