This article will review the most active stocks list and the various ways you can use it to find opportunities throughout the day to trade. By the end of this article, you will be better prepared to get the most out of the active stocks on the list.
What are the most active stocks today?
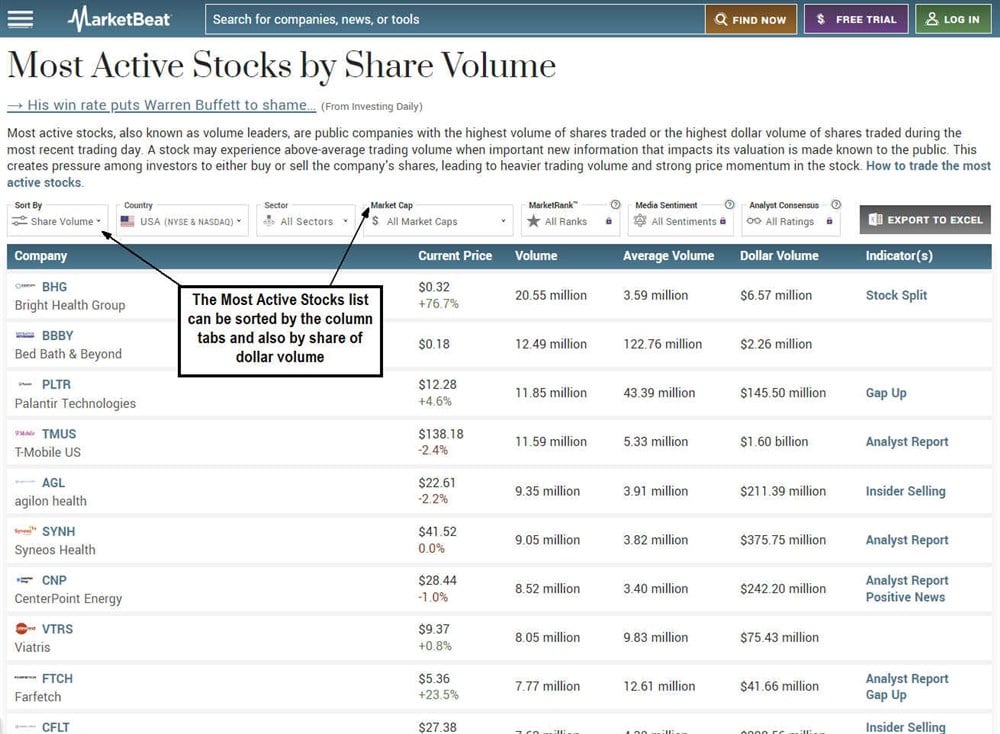
Today's most active stocks are a running list with the most daily volume. The order of the stocks can be sorted and listed by several factors, including alphabetically by company name, numerically by price, stock or dollar volume and market capitalization.
The MarketBeat active stocks list also listed the average volume for comparison and the indicator(s) that are the catalysts for causing the surge in trading volume.
Different data providers may offer more or fewer column headings to sort by, including percentage price change, indicator, pattern and news. Many providers may provide a limited number of the most active stocks, like the 10 ten most active stocks. Some active list providers will have a minimum requirement for price and volume. The Nasdaq most active stocks list as a minimum requirement for the stock price must be greater than $2 with daily volume greater than 3,000 shares.
Stocks that make the most active stock list will often be trading at multiple times their average volume. Remember that the average volume is based on the average total daily volume. The current volume may be smaller than the average volume in the morning. However, pay attention when the volume trades at two or three times the average volume within the first 30 minutes of the trading day. These stocks usually accompany a relatively large price move up or down. The most active stock tends to have a dramatic gap up or down, bringing attention to traders who add more volume and causing further price swings.
What causes a stock to be “most active?”
The most active stocks have attracted the attention of traders and investors, who continue to stir up more volume. There are reasons causing today's most active stocks to surge with volume. Some causes can trigger a stock to appear on the most active list.
News
The most common catalyst is material news compelling enough to cause traders and investors to jump into or out of the stock. Different stocks and their sectors are affected by other material news. Biotechnology stocks are highly reactive to news regarding clinical trial results and U.S. Food and Drug Administration (FDA) decisions for their drugs.
News of substantial contracts or orders can generate substantial volume since they impact the company's earnings. Analyst upgrades and downgrades can also trigger a significant surge in trading volume, causing the stock to make the most active stocks list.
Earnings report
Reactions to a company's earnings report and subsequent forward guidance are the most common catalyst for stocks making the most active list.
Publicly traded companies are required to file a Form 10-Q quarterly report three to four times annually. The market reaction can be unpredictable, where strong earnings may get a sell-the-news reaction, while weak earnings reports may get buyers thinking the worst is over.
Rather than try to predict how a company will perform on its quarterly earnings, it's more prudent to react after the release. The stocks with the most volume on their earnings report will make the most active list. Multiple catalysts, like analyst upgrades or downgrades, can stem from the earnings report.
Rumors
Rumors can gain legs if it seems plausible and the speculation comes from a perceived credible source. For example, if the Wall Street Journal publishes a rumor of merger talks or an acquisition bid for a stock, it will likely gap with enough volume to make the most active list.
Conversely, a post about the same thing from an anonymous X user will not get much of a reaction. Viable takeover rumors can get the most buying volume. Conversely, viable rumors of an impending earnings warning, court ruling, or regulatory action can trigger heavy selling volume.
What are the characteristics of the "most active" stocks?
Here are some characteristics of the stocks that make it onto the most active stocks list.
Dollar volume vs. share volume
The most active stock list includes stocks with the highest trading volume. It can also show the most active stocks based on the highest dollar volume. The stocks on the most active list will likely change when you switch between trading and dollar volumes.
Dollar volume takes into consideration the price of the stock. Many view the dollar volume as more critical since higher-priced stocks tend to be more widely held and maintain their liquidity. Conversely, higher dollar volume can overlook cheaper stocks that may make much larger percentage moves with significant liquidity for the day.
Average volume
The average volume for an active provides the context for the active stock. Knowing if a stock trades unusually more volume than average is essential. The ability to compare the magnitude of the interest in the stock is beneficial. It means there's more attention and interest in the stock based on some catalyst.
Lower-priced stocks may provide more opportunities for a more significant price move. However, as the trading volume falls back to the average volume levels, the liquidity will also dry up, leaving many investors "stuck" in the trade.
They are so underwater in the position that they can't sell. They can't sell their position without taking a dramatic loss because the spreads have widened from the thinner liquidity. Lower-price stocks are like a high tide with tons of liquidity that quickly recede, leaving the land dry again and causing fish and marine life to die.
Market capitalization
Market capitalization (market cap) also impacts the liquidity of the underlying shares. Stocks with a higher market cap tend to have more liquidity as there tend to be stronger hands, like institutions holding shares. Stocks with the highest market caps are usually widely held and are often blue-chip stocks. These stocks are also significant components in a benchmark index like the S&P 500.
Indicator
Stocks on the most active list tend to have a catalyst that's triggered interest in the stock. These indicators include news, events, analyst reports, insider trades and earnings reports. Search for the underlying indicator that caused the stock to make the most active list. The type of indicator can give you a better idea of the quality of the price move and the likelihood that the price gains will stick. It also pays to be aware of the short interest in the stocks.
Short interest greater than 20% has a higher probability of squeezing higher on favorable news. Short sellers chase the stock price to buy to cover their short positions. A short squeeze can also perpetuate them.
How to use a most active stocks today list
Now that you know what is the most active stock list, it is essential to know how to use the information provided by the most active stocks list. Here are some ways to utilize the information.
- Day trading opportunities: The most active stocks tend to present day trading opportunities due to the liquidity and volatility of the price moves. The most active stocks tell you where the action is and help you zone in your trading activities. Day trading requires price swings and volatility; the most active stocks tend to have both. Day trading pertains to both long and short selling. The most active stocks list can also list stocks gapping down due to a news event like lowered earnings guidance or missing expectations.
- Gauge the day's theme: The most active stocks tend to reflect a theme in the market. If many of the most active stocks are peers or within the same industry, it clues you into which sector may be hot for the day. Be aware of multiple stocks within the same industry on the most active stocks list. For example, the metaverse is a theme that can put many stocks on the most active list.
- Laggard opportunities: The most active stocks tend also to impact similar stocks in the industry, peers or competitors. For example, when a significant footwear maker reports solid earnings and makes the most active stock list, it moves other footwear makers as the momentum trickles down the totem pole. While you may be late to the party for the most active stock, you can play the laggards in the same industry for a catch-up or follow-up price move.
Should you buy the most active stocks?
Stocks on the most active list can be tempting to buy. However, it is crucial to administer patience.
Remember that many traders are in the stock before you discover it on the most active stocks list. It's also possible that it has already peaked after it makes the most active list for a final flurry of late buyers. Another way to play would be to find sympathy laggard stocks that have yet to make a move acting on the same theme.
Why are the top stocks by volume important?
The top stocks by volume are significant because volume ensures enough liquidity to enter and exit shares with less slippage. When the volume recedes to normal levels, the liquidity tends to thin out because fewer participants are trading the stock.
Example of an active stock
We can see the list sorted by volume using MarketBeat's most active stocks by share volume list. Clicking any headings will alphabetically sort the list by the heading if clicking "company."
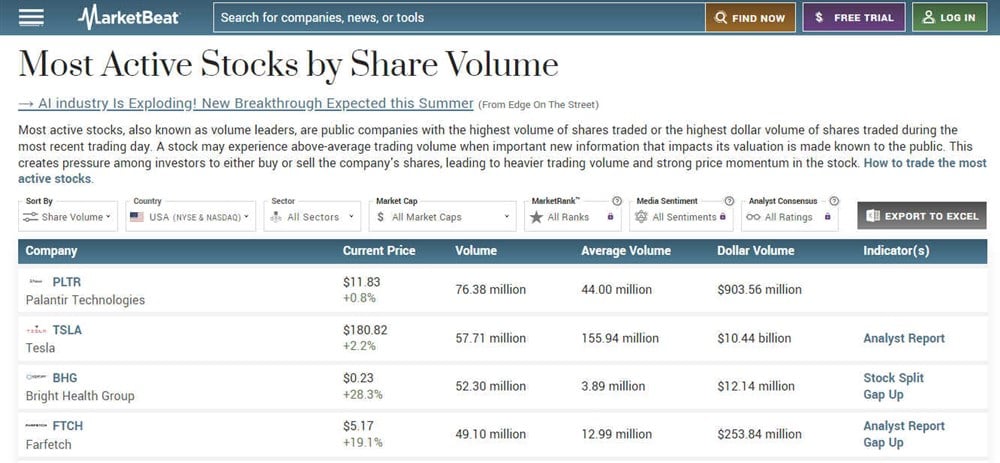
You can select a stock from the list to bring up more information. Let's take a look at Farfetch Ltd. (NASDAQ: FTCH). At first glance, you can tell from the low price that it's not a blue-chip stock.
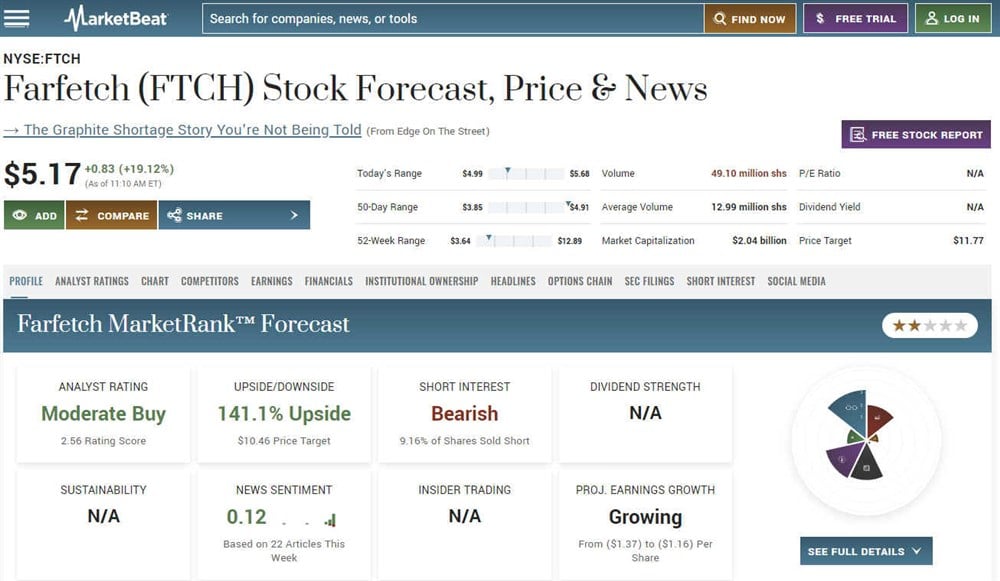
There are rich and deep layers of information to discover for your research, starting from the most active stock list. You can see the individual stock page pull-up for FTCH. You can read through the profile and click any other headings to get more detailed information. For example, you can find analyst ratings and price targets for Farfetch on MarketBeat. You can also access the chart, competitors, earnings, financial, institutional ownership, headlines, options chain, SEC filings, short interest and social media.
Watch out for FOMO
One of the main problems with watching the most active stock list is the fear of missing out (FOMO). This FOMO can trigger many traders into the most active stocks at their highest prices. The irony is that you will always be late to the party using the most active list.
It can be a game of musical chairs where the music can end anytime, leaving the last ones at the party trapped. It's a game of buying high and hoping to sell higher. Waiting for pullbacks can seem fruitless as the stocks charge higher, but it's better than impulse trading and chasing stocks at the wrong time.
FAQs
Here are answers to some frequently asked questions.
Which stock is currently the most active?
The most active stocks list will notify you of the most active stocks by trading volume or dollar volume. The list is dynamic, and it is essential to refresh it throughout the day. The most active stock can change throughout the market day as volume and participants may rise elsewhere. Most active stocks can come from any sector or be consumer discretionary or staples stocks if they report earnings.
How do I find the most actively traded stock?
You can find the most actively traded stock by using a most actively traded stock list. Your broker may provide one for you to use on your platform. You can also use the MarketBeat most active stocks list throughout the day. You can also use the most active penny stocks list on MarketBeat for seasoned speculators with risk capital to burn. You must have experience with penny stocks before using the list.
What are the five most popular stocks?