If you've looked at stock charts, you've likely heard of or seen moving averages. Dynamic curvy lines that continuously rise and fall represent them on the charts.
You can glean much information from using moving averages. Moving averages are some of the most commonly used chart indicators. They help to visualize trends and spot price inflection points. In this article, we'll do an in-depth rundown of how the moving average is calculated to understand the mechanics and how to apply them to help you select stocks for your trades.
Why not add moving averages to your arsenal of indicators for more informed decision-making on your stocks?
What is a Moving Average (MA)?
As the name says, a moving average is a stock's average price over a specified period. The average is determined by the closing price average from the number of periods and chart time increments the user selects.
It's a "moving" average because it continuously recalculates and updates every increment. For example, a five-period moving average on a five-minute chart will calculate a new moving average value every five minutes based on the average closing price of the prior five periods. Each moving average is then plotted and connected by a line on a stock chart to produce a single line used as a reference to gauge information about the price action.
Traders and investors can use moving averages to help in the decision-making process on stock trades. Traders and investors use them in technical analysis, which analyzes price action and chart patterns. Moving averages can be configured by the number of periods and the selected time increments. There are also many different types of moving averages. They are also standard in most charting software or platforms.
You can use them with other indicators or be part of them to interpret the price action better.
Moving Averages, Explained
In technical analysis, price and momentum are two types of chart indicators. Moving averages are a price indicator. They provide information and insights into price action based on historical trade prices.
Moving averages are created by taking the closing prices of a stock and averaging it by the selected number of periods and time frame increments. Since moving averages use historical price data, they are also considered a lagging indicator. They can be applied to any trading instrument or stock, whether a penny stock, high-yield dividend or a blue-chip stock.
This means they don't predict future moves so much as identify supports and resistances based on historical price data. They can also foreshadow potential moves, but we'll touch upon that later in the article.
Types of Moving Averages
There are two main types of moving averages. They have gone through an evolution of sorts. Just as you can configure the periods and time frame charts, you can also have a different type of moving average. Here are the two types to consider.
Simple Moving Average (SMA)
The simple moving average is the most commonly used type of moving average. It's pretty straightforward with no tweaks. In a nutshell, it calculates the average stock price over a specified period. For example, a 20-day moving average would add up the closing prices for the past 20 days and divide that number by 20. Every new day results in the last day dropping off, adding the recent day, and recalculating for an updated moving average. This results in a smooth line that rolls forward each trading day. These daily moving averages connect by a line to illustrate the trend.
Exponential Moving Average (EMA)
The exponential moving average was created under the belief that current prices have more relevance and should have a heavier weight. This is a weighted moving average that prioritizes recent prices over older prices. Therefore, the latest data points are weighted heavier than the older ones. This results in a tweaked moving average that many argue produces a quicker and updated moving average than the simple moving average.
How is a Moving Average Calculated?
The calculations for the two types of moving averages are as follows:
Here's how to calculate a simple moving average. It's calculated by adding up the total number of periods and dividing by the total number of periods. Each new period drops the oldest and recalculates the average, including the new period value. The simple moving average formula is:
SMA = C1 + C2 + C3 / P
The simple moving average equals the closing price of period 1 and period 2 plus the closing price of period 3 divided by the number of periods. For example, if we do a five-period SMA with the following closing prices: 6 + 6 +8 + 9 + 10 = 39 / 5 = 7.8 SMA.
Each new period would drop off the oldest closing price, add the new closing price, and recalculate the formula for an updated SMA. Each SMA is plotted and connected with a line to produce the SMA line.
Here's how to calculate an exponential moving average. It's calculated by calculating the SMA and then recalculating it with the weighted multiplier. We calculated the multiplier by dividing 2 by the number of periods plus 1. For example, for the five-period SMA, we divide 2 by the number of periods plus one: 2/(5+1) = 0.33 multiplier.
We then take the recent EMA and subtract the previous day's EMA, multiply the difference by the multiplier and then add back in the prior day's EMA. The formula looks like this:
EMA = (Today's closing price – Yesterday's EMA) x Multiplier + Yesterday's EMA
In the previous example, we take today's closing price 10 minus yesterday's EMA 8.29 = 1.71 multiplied by 0.33 multiplier = 0.56 + 8.29 = 8.85.
Comparing the SMA of 7.8 to the EMA for the same five periods and data points is 8.85. This gives the EMA a higher value of 1.05, meaning the EMA reacts quicker to price changes by adding more weight to the newer closing prices. This makes exponential moving averages a preferable alternative for short-term and day traders since they are updated quicker with arguably more relevant time-sensitive values.
What Does a Moving Average Show?
A single moving average shows the direction of the trend and support or resistance. If the moving average line rises, it's in an uptrend. If the moving average line falls, the stock is in a downtrend. If the stock trades above the moving average, then the moving average is support. If it trades below the moving average, it's a resistance. It's pretty simple, but it could be better. If one moving average is good, then two moving averages tell an even more detailed story.
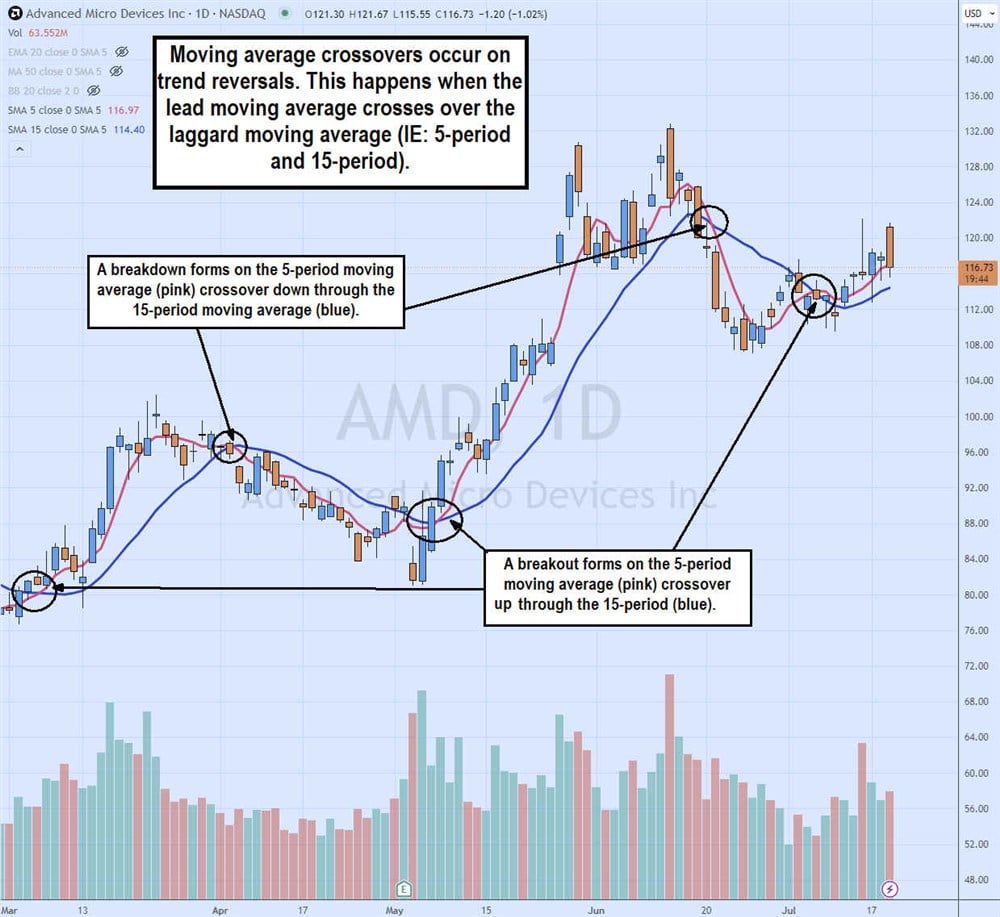
Using two moving averages gives you a lead moving average and a laggard moving average. The laggard moving average has a larger number of periods. For example, a 5-period simple moving average and a 15-period simple moving average is a common and effective moving average combo. The 5-period moving average is the first support, and the 15-period moving average is the second support level. This can help you use a trailing stop if the stock breaks the 15-period moving average.
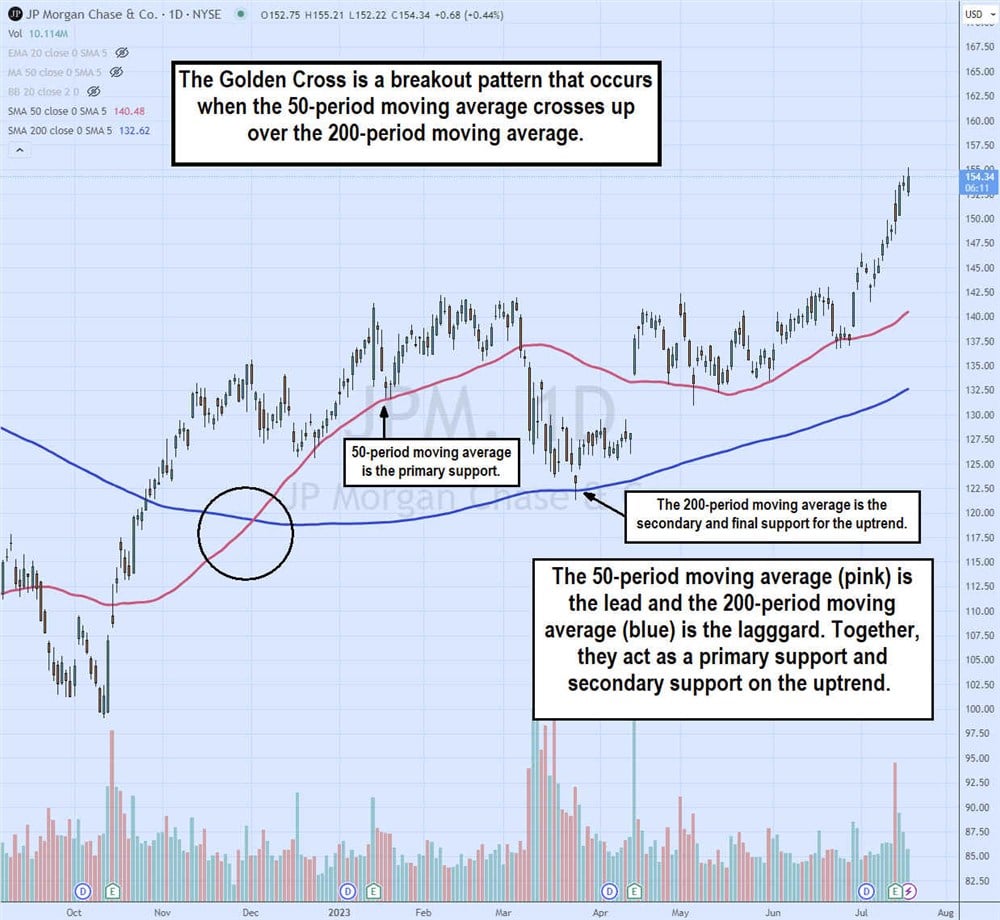
Additionally, two moving averages provide more information by adding the trading channel between the 5-period and 15-period moving averages. Most importantly, it can visually illustrate a trend reversal when the leading moving average (5-period moving average) crosses over the laggard (15-period moving average). Moving average crossovers are commonly used as trend reversal signals. One of the most widely used signals is called the golden cross pattern, when the 50-period moving average crosses over the 200-period moving average on a daily chart.
How to Use a Moving Average for Trading
To use moving averages in trading, you must first understand what information you derive from them. You must also select which moving averages to use and the appropriate time frames. Your trading style will determine it, whether intraday, medium-term swing, or long-term investing. As explained earlier, an exponential moving average may be considered for intraday trading, while simple moving averages can be considered for intraday and swing trading. The periods are also something to consider.
Common smaller timeframe periods are the 5-period and 15-period moving averages. The 50-period and 200-period moving averages are preferred for wider time frames. Many traders prefer a 20-period exponential moving average combined with a 50-period simple moving average and any combination.
Example of a Moving Average
Look at the moving averages on the daily chart of United Airlines NYSE: UAL stock.
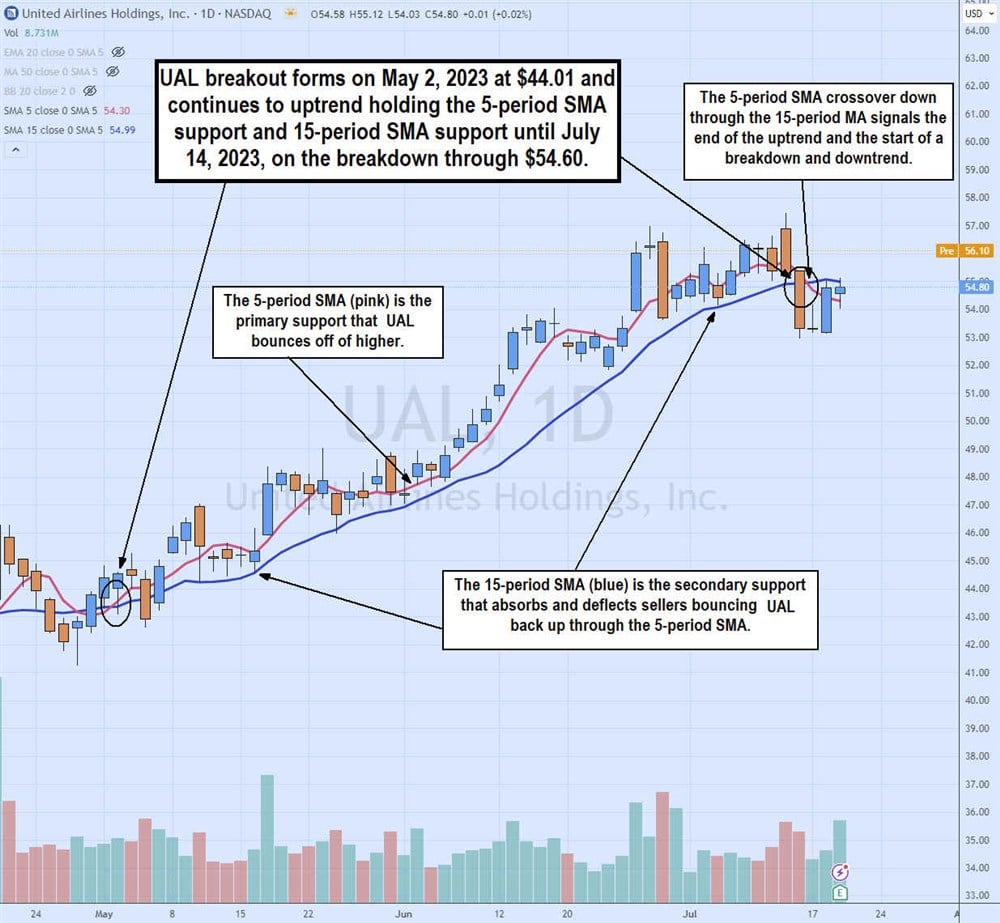
The UAL daily chart has the five-period simple moving average (SMA) in pink and the 15-period simple moving average in blue. We can see the 5-period SMA crossing through the 15-period SMA on May 2, 2023, at the $44.01. UAL's uptrend starts its journey by making higher highs and higher lows. Notice that the 5-period SMA is the first line of support, and if the stock falls below it, then the 15-period SMA is the secondary support that the price bounces off. This is why having two moving averages makes sense, so you aren't head faked out on a slip through the 5-period SMA inadvertently.
Each time UAL slips under the 5-period SMA, it bounces at or near the 15-period SMA back up through the 5-period SMA to higher highs. If you were to have taken UAL long on the breakout, you would ride the uptrend until a breakdown occurs. This happened on July 14, 2023, as the 5-period SMA crossover down through the 15-period SMA at $54.60 marked the end of the uptrend and the start of a breakdown and subsequent downtrend.
Disadvantages of Moving Averages
The biggest complaint about the moving average method is that they are a laggard indicator and lack any predictive abilities. Moving averages are essential when performing stock analysis using charts and evaluating stocks before investing. Using historical information results in lagging results. While this may be true, it's also important to remember that historical prices provide information that can help us prepare for future moves. It's important to avoid mixing the terms predictive and foreshadowing in the stock market or any financial market. Predicting a price move is like guessing which day it will snow in August. It's a guess at best.
There's little you can do with a guess. However, foreshadowing can help you to react better. Foreshadowing is not a prediction; rather, it's like a Doppler radar that the weatherman uses to tell you there's a snowstorm coming to your area. Traders tend to make the mistake of trying to guess which day in August it will snow and throw a dart versus waiting for it to snow and reacting to it by turning on the heat. There's an old saying amongst traders, "Trade what you see, not what you think." React, don't try to predict.
Doppler Effect
Speaking of the Doppler effect. Good chart indicators are linear across all time frames and trading instruments. This means a moving average that is accurate on a daily time frame should be just as accurate on a 5-minute time frame. A weatherman doesn't predict; he forecasts using a Doppler radar that gives an image of an existing storm and its impending path to your neighborhood. The same Doppler effect can be manifested with moving average charts with the addition of a momentum indicator and multiple time frames.
Think of multiple time frames as having the ability to see a Doppler radar to gauge the weather from a stateside view, then a city view, then a local view and even a neighborhood view. If there's a strong Nor'easter snowstorm heading to your state and your city is in its forecasted trajectory, there is a high probability it will hit your neighborhood. This isn't a guess but a foreshowing. With this information, you can prepare to react if it hits your neighborhood. The same analogy works with technical analysis.
You can manifest a Doppler effect for stock price movement by using moving averages to determine the trend and support, resistance levels and a momentum oscillator like the relative strength index (RSI) to determine the overbought and oversold conditions. Using wider time frames like daily and weekly can help to foreshadow a smaller time frame breakout on the 5-minute and 15-minute charts as the smaller time frame downtrend eventually conforms to the wider time frame uptrend. Moving average forecasting can be performed by adding a momentum indicator and multiple time frames. Additional price indicators like Bollinger Bands to determine the price trading range and price compression and expansion phases can provide more color.
FAQs
Here are answers to some frequently asked questions.
It's simple to calculate a moving average. The formula for simple moving average (SMA) calculation is SMA = C1 + C2 + C3 / P. Take the stock's average price for the selected periods and divide it by the number of periods. For example, a 5-period SMA with the following prices at $6,$4,$7,$8 and $11 equals $36 total divided by 5 periods equals an SMA at $7.20. The next SMA would add the new price while dropping the last price and recalculating. The moving average line is formed by connecting the SMA plots. Most charting platforms have moving averages that automatically plot, so you no longer have to do them by hand.
How do you calculate the three-month moving average?
For calculating a moving average for three months, let's assume the three-month period comprises 90 days. Add up the closing stock prices for the past 90 days and divide that figure by 90. This will produce a simple moving average.
How do you calculate a seven-day moving average?
The seven-day moving average is calculated by adding each closing price for the seven days and then averaging that figure by seven. Each day produces a new closing price while deleting the last closing price of the sequence and recalculating for an updated moving average. Connect the moving averages by a single line, and you have your seven-day simple moving average (SMA) line.
Before you consider Exponent, you'll want to hear this.
MarketBeat keeps track of Wall Street's top-rated and best performing research analysts and the stocks they recommend to their clients on a daily basis. MarketBeat has identified the five stocks that top analysts are quietly whispering to their clients to buy now before the broader market catches on... and Exponent wasn't on the list.
While Exponent currently has a Moderate Buy rating among analysts, top-rated analysts believe these five stocks are better buys.
View The Five Stocks Here
With the proliferation of data centers and electric vehicles, the electric grid will only get more strained. Download this report to learn how energy stocks can play a role in your portfolio as the global demand for energy continues to grow.
Get This Free Report
Like this article? Share it with a colleague.
Link copied to clipboard.