But what does that mean? What does it mean to research stocks? We'll show you how to analyze a stock in four steps and the various types of analysis that you can incorporate. The actual legwork in investing or trading is the research and analysis before clicking the buy and sell buttons. Analysis helps you make more informed decisions on your trades and can help you sleep better at night with your investments.
This guide to how to analyze a stock for beginners is tailored for all skill levels, as experienced investors can use it as a template to improve on their process.
What is Stock Analysis?
Stock analysis is a process that involves researching, examining and evaluating publicly traded companies. Proper stock analysis utilizes publicly available information to cultivate more informed stock decisions. It should help to shape a thesis on the underlying company and its stock price and plan what actions or reactions to take. Stock analysis can take minutes to hours or even days. The depth of analysis varies depending on how much time and effort you put into it.
As you get acclimated to analyzing stocks, you can become more proficient and efficient with your time and effort. As you learn how to analyze a company stock, you will gain knowledge of things to watch out for, catalysts, red flags and ways to compare stocks. Stock analysis applies to all stocks, from blue chips to penny stocks, and you can streamline it as you get more experience. It can take years to become proficient — think of it as a lifetime learning process that can pay off in many ways.
Three Types of Stock Analysis
Generally, you can perform stock analysis in three ways. Depending on your preferences, you can use either one or a combination of them. Here's a rundown of each type.
Fundamental Analysis
Fundamental analysis examines the underlying company's operations, including financials, press releases, SEC filings and even rumors. Publicly traded companies must have quarterly financial disclosures filed with the U.S. Securities and Exchange Commission (SEC) four times a year. Companies must also disclose material nonpublic information to the public under Regulation FD, which states any information disclosed to stock analysts or investors could trade off the information.
Usually, you can find these disclosures through an 8-K filing on the SEC's EDGAR database. It creates a level playing field concerning company information. These disclosures provide financial and operational details can make more informed decisions on potential investments in the stock. Fundamental analysis does not analyze stock price. It just focuses on the underlying company's business and news.
Technical Analysis
Technical analysis examines and interprets a stock's price action to gauge the direction, significant price levels and potential price patterns, helping you learn how to analyze a stock before buying.
Technical analysis doesn't involve the company's underlying operations or business, only the stock price. The belief behind technical analysis is that a stock's price is only affected by supply and demand, and tracking that supply and demand using charts and indicators can help users react. Often, stock patterns precede news. Technical analysis is useful when a stock's price reacts opposite the news.
Sentiment Analysis
Sentiment analysis is a new type of analysis spawned from social media. It became famous during the 2021 meme stock mania, when the Wall Street Bets Reddit forum short-squeezed GameStop Corp. NASDAQ: GME stock from $6 to over $400 in weeks. More and more charting and research platforms utilize it. While it is a type of analysis, you can't use it alone, as it's very discretionary. The majority of the herd can influence it (which can often be wrong).
This fact is understated as there's very little coverage about the traders and investors who were "stuck" with GME shares at prices in the hundreds as they crashed into the $20 range.
Sentiment analysis comes from data from various social media platforms like Twitter, Reddit, Facebook and financial blogs, news articles and websites. It can be dangerous because it often drives impulse trading. Many sites and platforms provide a sentiment analysis tool that can complement the other forms of research to help shape your thesis.
However, it's best to take it with a grain of salt as stocks tend to peak out when the volume and sentiment are at their highest point. MarketBeat has an objective news sentiment ranking based on the number of good and bad news articles and weekly search results about stocks.
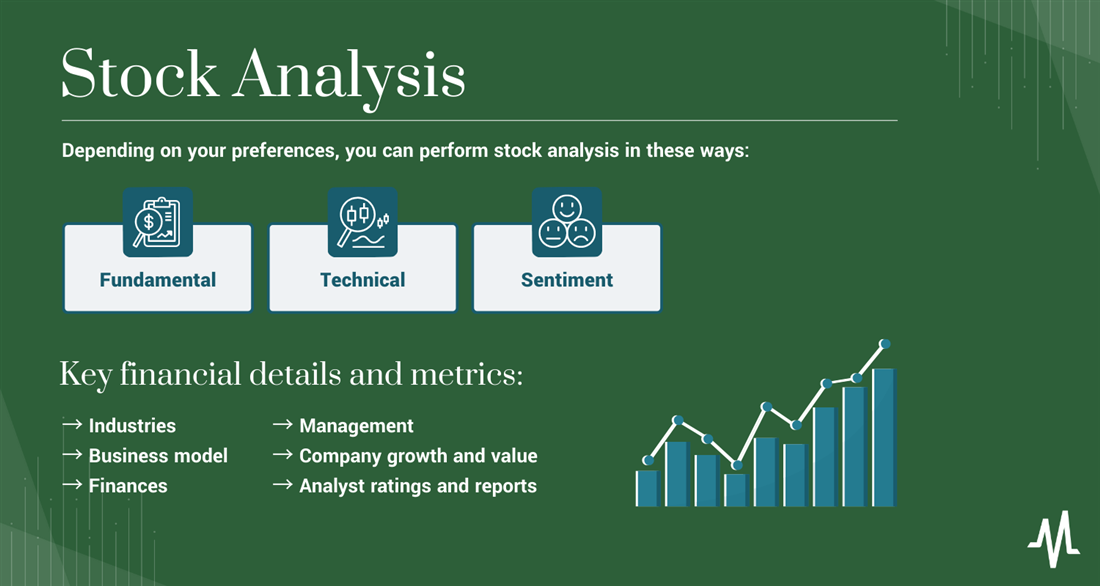
What to Analyze Through Stock Analysis
When you perform stock analysis, there are some key financial details and metrics to pay attention to. Practice using the following checklist to get your routine down.
Industries
There are 11 sectors in the benchmark S&P 500 index. Each sector contains many more industries. All stocks fall into an industry. Some sectors and industries will have relative strengths and weaknesses on any given day. Industries are an excellent way to group stocks. You will find that peers and competitors in an industry tend to follow the same trends and often have similar valuations, which creates a parlay effect where a thorough stock analysis within an industry will give you a lead on your analysis for other stocks in the industry. After enough stocks, you will get a good feel for the industry and its components' business and price trends.
Business Model
Try to understand the business model of the underlying company behind the stock symbol. Find out how it makes its money and what can affect that. What is its industry and its characteristics? What competitive advantage, if any, does the business have among its peers?
Finances
Read the latest quarterly report and check its balance sheet and income statement. Gauge its rate of growth for top and bottom lines. Learn about its various financial metrics, including price-earnings (P/E), price-sales (P/S), book value, cash per share, debt-to-equity ratio, free cash flow, and long-term debt. Get a picture of its financials and the direction the company plans to go.
Management
Peruse its board of directors, including the CEO and CFO. Gauge their prior history and track record. More importantly, are there new or incoming members of management to be aware of? Read the earnings transcripts of the recent conference calls to read the comments from the CEO and their insights on the business.
Company Growth and Value
Check the aforementioned financial ratios and compare them to peers to gauge if the stock may be a value play. Is the company a growth stock with 20% or higher year-over-year (YoY) revenue growth? Is it a value stock trading at low P/E multiples with a steady and consistent dividend? Most blue-chip stocks fall into one or the other category. Some blue-chip stocks are both growth and value stocks, indicating an opportunity to buy in before the market prices them accordingly.
Analyst Ratings and Reports
Read analyst research reports and articles from trusted sites to familiarize yourself with the company. Doing so can save much initial legwork with the fundamental research and have you hit the ground running. It can also provide critical insights to help shape your these on the stock.
MarketBeat Originals articles provide actionable and relevant stock market and specific stock ideas daily with original human (not AI) generated content to help with your stock analysis.
Strategies to Use for Analysis
Here are the various strategies to use for stock analysis. These strategies will also help determine the type of trade or investment the stock is suited for, enabling you to plan your trade. Anchor your analysis to the investing or trading strategy that best suits the stock and your preferences. Many stocks will fall into multiple categories, so apply fundamental, technical and sentiment analysis as applicable.
Value Investing
This type of investing is suited for value investors seeking undervalued stocks. This uses fundamental analysis and compares financial ratios like P/E to other stocks in the industry to determine if shares are a value. Profits and moderate growth are mainstay.
Value investors sleep better at night knowing they got into a stock at a discount to the market. In unique situations, a stock may be punished unfairly, presenting a value opportunity. The hunt to uncover stocks trading at a discount to the industry drives this type of analysis.
Growth Investing
Growth investing involves analyzing companies that have exceptional revenue growth. While profits are preferred, they aren't the mainstay or a deal breaker. Profits will presumably come later, but growing the top line is the priority. Growth companies have increasing double-digit revenue growth rates. Growth investing requires fundamental analysis but can also add technical analysis since the underlying company may not have a P/E due to losses. Many growth stocks eventually become value stocks as they become profitable blue chips. Growth stocks gather in various industries like information technology and communications. While growth versus value investing are opposite strategies, they can be complementary when you find reasonably priced growth stocks.
Momentum Trading
This strategy uses technical analysis to find stocks with strong rising price trends. These can be growth stocks that are charging higher fast. Momentum investing or trading involves investors and traders piling into stocks with substantial volume and a sharp uptrend with less attention to fundamental research other than news. Sentiment analysis can also be helpful since the momentum is generated by a more significant number of participants and enormous interest among the retail crowd.
Dividend Investing
This income strategy aims to generate consistent quarterly or monthly income from stock dividends. Usually, they are blue-chip stocks that have a history of consistent and rising dividend payouts. Stable growth and predictable guidance are mainstays for attractive companies to dividend investors. Fundamental analysis plays a significant role since these stocks tend to be held for long-term investors to take advantage of consistent income and the compounding effect if reinvested.
How to Analyze Stocks
Repeat the following routine enough times to become second nature. There are four basic steps to analyzing stocks.
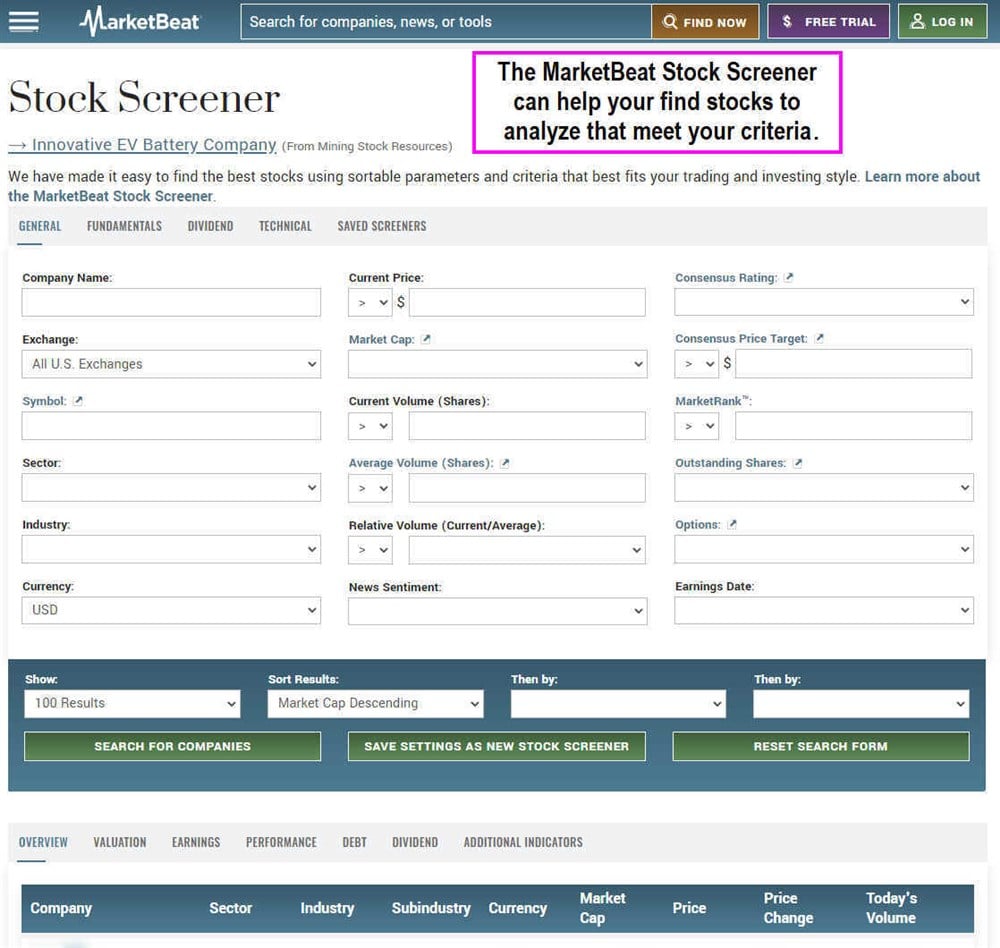
Step 1: Find a stock.
You can't do stock analysis without stocks. Tailoring your stock search by the investing or trading strategy is prudent. For example, if you're looking for stable but undervalued stocks, apply a growth investing strategy and find companies that meet the criteria for being undervalued. You can also use screeners like the MarketBeat Stock Screener to configure your search by various fundamental and technical criteria.
Do your fundamental research on the company by reading press releases, 10-Ks, quarterly reports and conference call transcripts. It also helps to read articles and research reports from trusted sites to familiarize yourself with the company.
Be familiar with upcoming analyst expectations for revenues and profits and any other metrics that may apply. Most importantly, have a thesis and a list of positives and negatives for the stock, including news, upcoming catalysts and events. Also, note if the company is involved in secular trends, tailwinds and headwinds. If you've done a thorough fundamental analysis, you should be able to "pitch" the stock to another person.
Doing technical analysis requires you to have access to charts like candlestick charts. Pick a time frame, whether intraday for trading or daily, weekly, or monthly charts for swing trading and investing. Look to find support and resistance levels along with the direction of the trend. Try to identify any chart patterns, whether they are positive or negative, and be objective. To learn how to analyze a stock chart, try the free definitive beginner's guide to reading stock charts on MarketBeat. With the support and resistance areas, anticipate good price levels for entry or exits and have them ready for the final step.
Step 4: Plan your trade.
The final step of stock analysis is to prepare your trading plan for the stock. Whether it's to day trade or hold long term, it still takes planning. The fundamental analysis supports your reasoning for the trade or investment. The technical analysis enables you to pinpoint entries and exits for the stock based on price patterns and key price inflection points like support and resistance levels. You can also have your own price target levels similar to analysts so that you have an end goal in mind.
Example of Analyzing a Stock
Let's take an example and run it through the four-step stock analysis process.
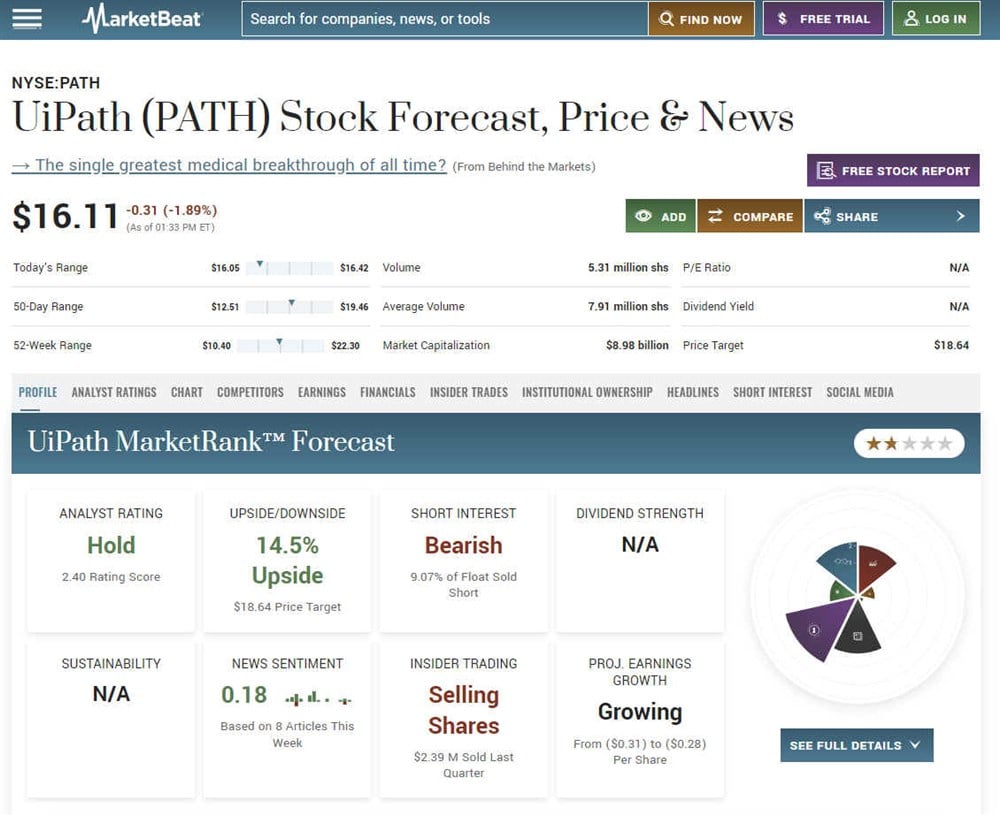
Step 1: Finding a stock.
Since artificial intelligence (AI) is a strong tailwind, let's look at UiPath Inc. NASDAQ: PATH. The company is the leader in robotic process automation (RPA) and business process automation (BPA) software. Here's a MarketBeat Original article on UiPath Inc. to help you get familiarized with the business.
Step 2: Completing fundamental analysis.
AI is a very hot industry and getting hotter. UiPath is a benefactor of this global trend. Their AI-powered platform enables companies to automate tasks like data entry, web scraping, IT, claims processing, bookkeeping and customer service using their software "robots." It enables companies to be more efficient while saving on labor costs and optimizing talent to handle more complex tasks.
The company is profitable and growing. For its first-quarter fiscal 2024 earnings report, UiPath beat the nine-cent earnings-per-share (EPS) estimate by two cents. The company is non-GAAP profitable but still red on a GAAP basis, which prevents it from having a P/E. Revenues grew 18.2% year-over-year (YoY). The stock sold off because they slightly lowered their fiscal Q2 2024 estimates but raised their fiscal full-year 2024 guidance. Some contracts may have been pushed to close later in the year. It makes sense since companies take a long time to scrutinize deals in this macroeconomic climate.
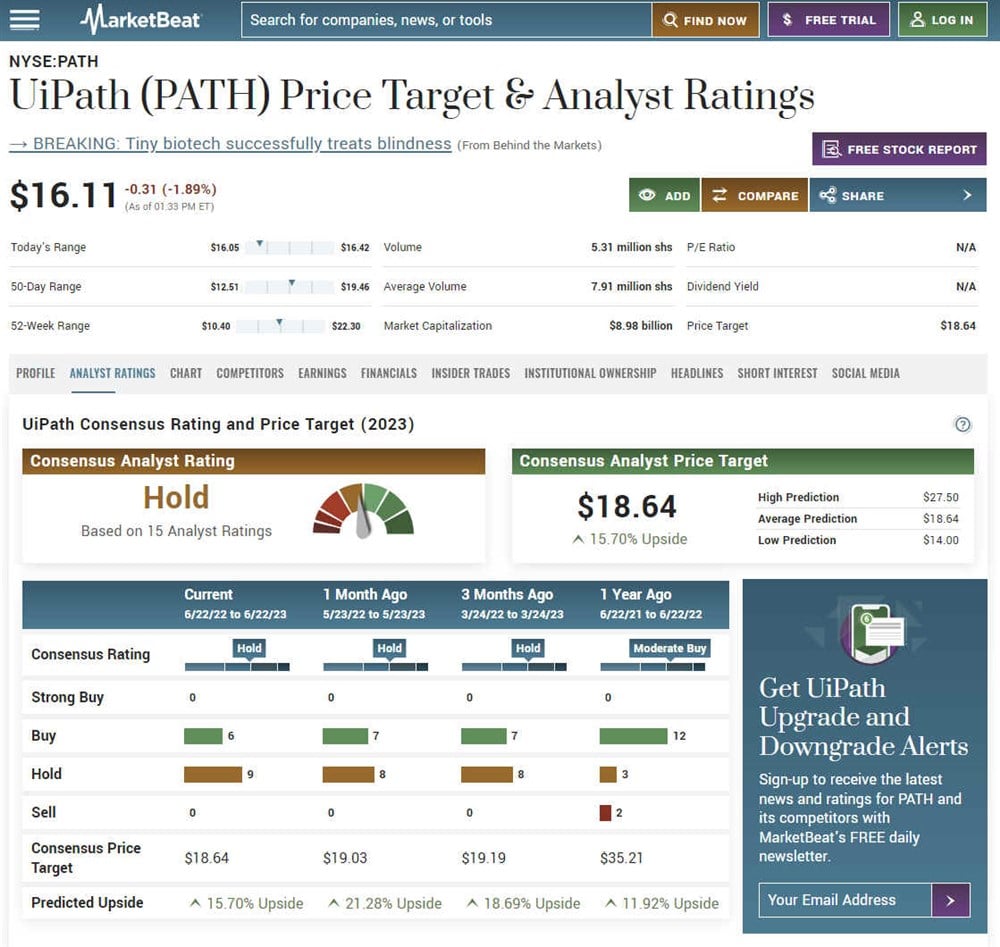
Checking the MarketBeat analyst ratings and price targets, UiPath has an average "hold" rating based on 15 stock analysts with an $18.64 average price target, 14.5% higher than the current price. The company pays no dividend but has a short interest of 9%, which can help spark a short squeeze on big news.
Step 3: Employing technical analysis.
Looking at the weekly candlestick chart for PATH, an ascending triangle formation started in October 2022, making a bottom of $10.40 and staged a rally peaking around $17.58. While the stock rose through that level several times, its weekly candle couldn't close above that level. This creates the flat-top trendline resistance at $17.56. The pullbacks have been creeping up, making higher lows, which formed the ascending triangle. PATH might be breaking down in Mary 2023 as PATH fell through the ascending triangle trendline at $14.27.
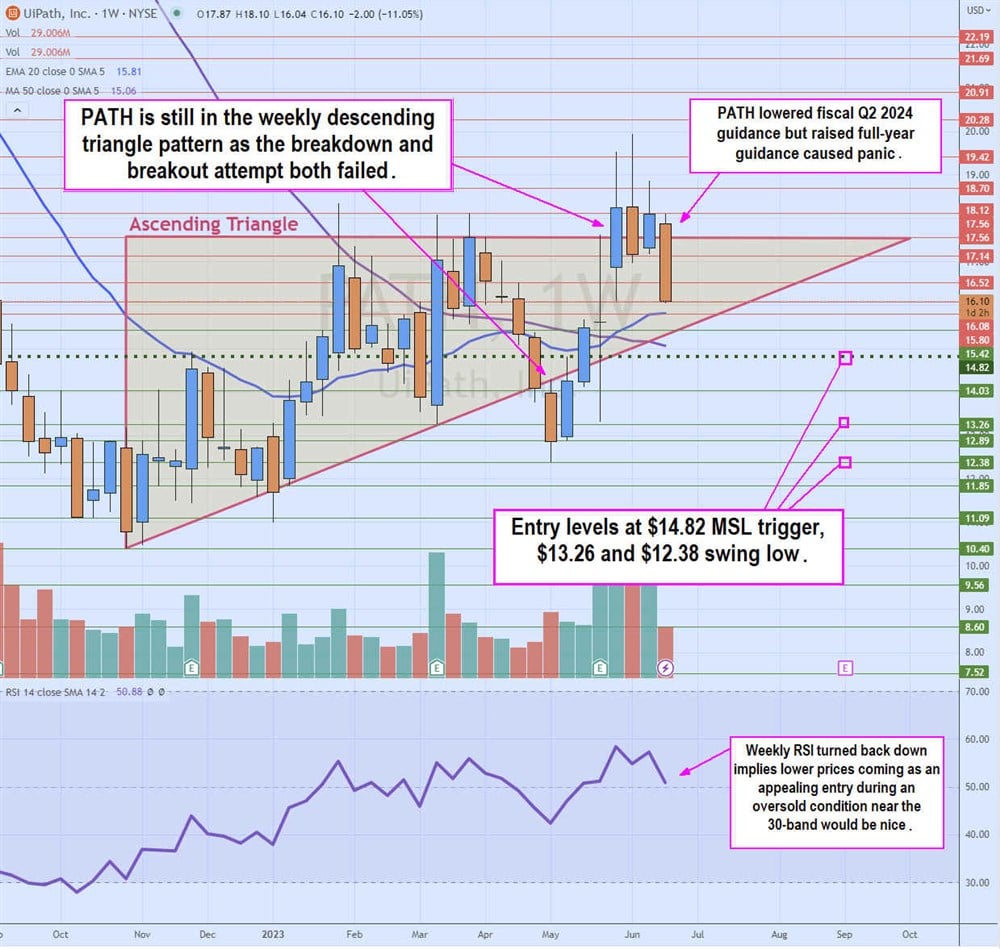
PATH made a swing low bottom at $12.38 and staged a slingshot bounce when it bounced through the $14.82 weekly market structure low (MSL) trigger. PATH attempted to break out through the triangle top resistance at $17.56, reaching as high as $19.94 at the beginning of June 2023. That was short-lived as PATH collapsed on its fiscal Q1 2024 earnings report back into the triangle. The ascending trendline is still rising at $15.37. The relative strength index (RSI) appears to have peaked at the 60-band and started to fall again. There is support at the weekly 50-period moving average (MA) at $15.06 and the MSL trigger at $14.82.The most recent swing low was around $12.89 in May 2023. These are three price inflection points to use as potential entries.
Step 4: Planning the trade.
We've done our fundamental research and know PATH is in a hot industry. It's the leader in RPA and BPA. The company is still growing revenues and non-GAAP EPS. The stock fell on an earning beat, but the short-term miss for the next quarter was replaced with a fiscal full-year 2024 guidance raise. PATH has an ascending triangle pattern on the weekly candlestick chart with key support levels as potential entry prices at $14.82 and $12.38.
Using the consensus analyst average price target around $18.64 gives a potential 15% to 20% gain. With our stock analysis complete, all that's left is to wait for the proper entry on pullbacks caused by the falling weekly RSI.
Comparing Stocks
As you get proficient with stock analysis, you will want to get into the practice of comparing stocks. This is crucial for value investing since you seek "bargains" in an industry. It also helps to do stock analysis on stocks within the same industry so that you can get a better idea of the scope and trends.
Most stocks in an industry have a positive correlation and move together in the same direction. However, there will be times when stocks within the same industry have a negative correlation and move opposite of each other, especially competitors. Being able to compare stocks enables you to build your frame of reference and measurement for valuation, which you can compare to the analysts. Ultimately, the stock's price will decide if you were right or wrong. Stock analysis is a perpetual process that improves with repetition.
FAQs
Here are some answers to frequently asked questions about how to analyze stocks.
What should I analyze before buying a stock?
Do fundamental analysis to understand the company's business, growth prospects and strategy. Compare to other stocks in the industry to see if there's a value play. Use technical analysis to gauge price support and resistance levels and to plan your entry and exits.
How do you analyze stocks for day trading?
Day trading relies on technical analysis over fundamental analysis. Day trading requires a focus on the price of a stock more than the day-to-day company operations. Familiarize yourself with chart patterns and indicators to find trade signals. News is the key fundamental driver for day trading stocks, but try not to form too strong of an opinion; rather, just react to the market's opinion, which is bestowed in the price action.
What are the three types of stock analysis?
Fundamental analysis involves researching the underlying company's business and valuation utilizing publicly available information. Technical analysis is the process of researching the price action for a stock utilizing charts and indicators. Sentiment analysis gauges the sentiment of a stock based on social media data.
Before you consider UiPath, you'll want to hear this.
MarketBeat keeps track of Wall Street's top-rated and best performing research analysts and the stocks they recommend to their clients on a daily basis. MarketBeat has identified the five stocks that top analysts are quietly whispering to their clients to buy now before the broader market catches on... and UiPath wasn't on the list.
While UiPath currently has a Hold rating among analysts, top-rated analysts believe these five stocks are better buys.
