Renaissance Technologies LLC trimmed its position in Enerpac Tool Group Corp. (NYSE:EPAC - Free Report) by 35.8% in the fourth quarter, according to its most recent filing with the SEC. The institutional investor owned 145,369 shares of the company's stock after selling 80,900 shares during the period. Renaissance Technologies LLC owned about 0.27% of Enerpac Tool Group worth $5,973,000 as of its most recent SEC filing.
Other institutional investors and hedge funds have also recently added to or reduced their stakes in the company. Assetmark Inc. bought a new position in shares of Enerpac Tool Group in the fourth quarter valued at approximately $29,000. First Horizon Advisors Inc. bought a new position in Enerpac Tool Group in the 4th quarter valued at $36,000. Venturi Wealth Management LLC purchased a new stake in shares of Enerpac Tool Group during the 4th quarter valued at $51,000. Heck Capital Advisors LLC bought a new stake in shares of Enerpac Tool Group during the 4th quarter worth $99,000. Finally, KBC Group NV boosted its holdings in shares of Enerpac Tool Group by 91.7% in the 4th quarter. KBC Group NV now owns 2,561 shares of the company's stock worth $105,000 after buying an additional 1,225 shares during the last quarter. Hedge funds and other institutional investors own 97.70% of the company's stock.
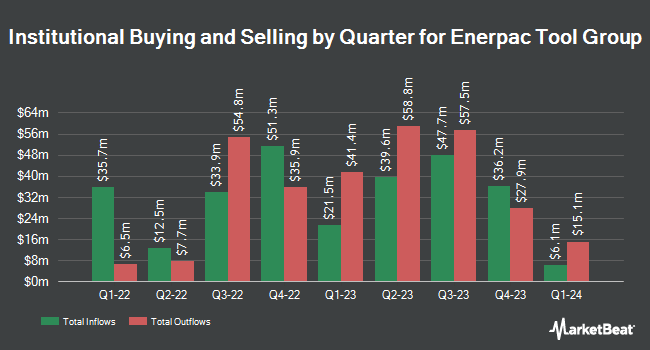
Enerpac Tool Group Stock Performance
Shares of NYSE:EPAC traded up $0.70 during mid-day trading on Thursday, reaching $39.77. The company had a trading volume of 36,869 shares, compared to its average volume of 331,287. Enerpac Tool Group Corp. has a one year low of $35.12 and a one year high of $51.91. The company has a current ratio of 2.92, a quick ratio of 2.24 and a debt-to-equity ratio of 0.47. The company's 50-day moving average price is $43.07 and its 200-day moving average price is $44.46. The firm has a market cap of $2.15 billion, a price-to-earnings ratio of 24.23 and a beta of 1.08.
Enerpac Tool Group (NYSE:EPAC - Get Free Report) last issued its earnings results on Monday, March 24th. The company reported $0.39 earnings per share (EPS) for the quarter, meeting the consensus estimate of $0.39. The firm had revenue of $145.53 million for the quarter, compared to analyst estimates of $139.80 million. Enerpac Tool Group had a return on equity of 25.39% and a net margin of 15.14%. As a group, equities research analysts anticipate that Enerpac Tool Group Corp. will post 1.78 EPS for the current fiscal year.
Wall Street Analyst Weigh In
Separately, CJS Securities began coverage on shares of Enerpac Tool Group in a report on Friday, March 14th. They set an "outperform" rating and a $53.00 price objective for the company.
View Our Latest Stock Analysis on EPAC
Enerpac Tool Group Company Profile
(
Free Report)
Enerpac Tool Group Corp. manufactures and sells a range of industrial products and solutions in the United States, the United Kingdom, Germany, Australia, Canada, China, Saudi Arabia, Brazil, France, and internationally. It operates through Industrial Tools & Services and Other segments. The Industrial Tools & Services segment designs, manufactures, and distributes branded hydraulic and mechanical tools; and provides services and tool rentals to the infrastructure, industrial maintenance, repair and operations, oil and gas, mining, alternative and renewable energy, civil construction, and other markets.
Read More
Before you consider Enerpac Tool Group, you'll want to hear this.
MarketBeat keeps track of Wall Street's top-rated and best performing research analysts and the stocks they recommend to their clients on a daily basis. MarketBeat has identified the five stocks that top analysts are quietly whispering to their clients to buy now before the broader market catches on... and Enerpac Tool Group wasn't on the list.
While Enerpac Tool Group currently has a Buy rating among analysts, top-rated analysts believe these five stocks are better buys.
View The Five Stocks Here
Discover the 10 Best High-Yield Dividend Stocks for 2025 and secure reliable income in uncertain markets. Download the report now to identify top dividend payers and avoid common yield traps.
Get This Free Report
Like this article? Share it with a colleague.
Link copied to clipboard.