
Previous users of Google Finance may think that this article should be titled “Why Would You Ever Use the New Google Finance Tool?” because unfortunately for long-time Google Finance users, the update is a case where less is … less. Google has not provided a rationale for stripping down their new interface of many of the features that made it useful to their audience. The most notable absence is its portfolio tool that allowed users to track their portfolios in real time.
Nevertheless, the new Google Finance tool that launched in November 2017 is here to stay and while updates may come at a future date, we want to help you understand the new version and how to get the most out of it.
What is Google Finance?
If you’re still reading, Google Finance is a search tab within Google.com. For years, Google has had different tabs related to the user's interests (News, Images, Maps, Shopping, etc.). Adding Finance to this seemed like a logical way to provide users with basic financial information to feed, according to Google, “an interest in the global search for finance and stocks that have more than doubled in the last five years”.
How does Google Finance work?
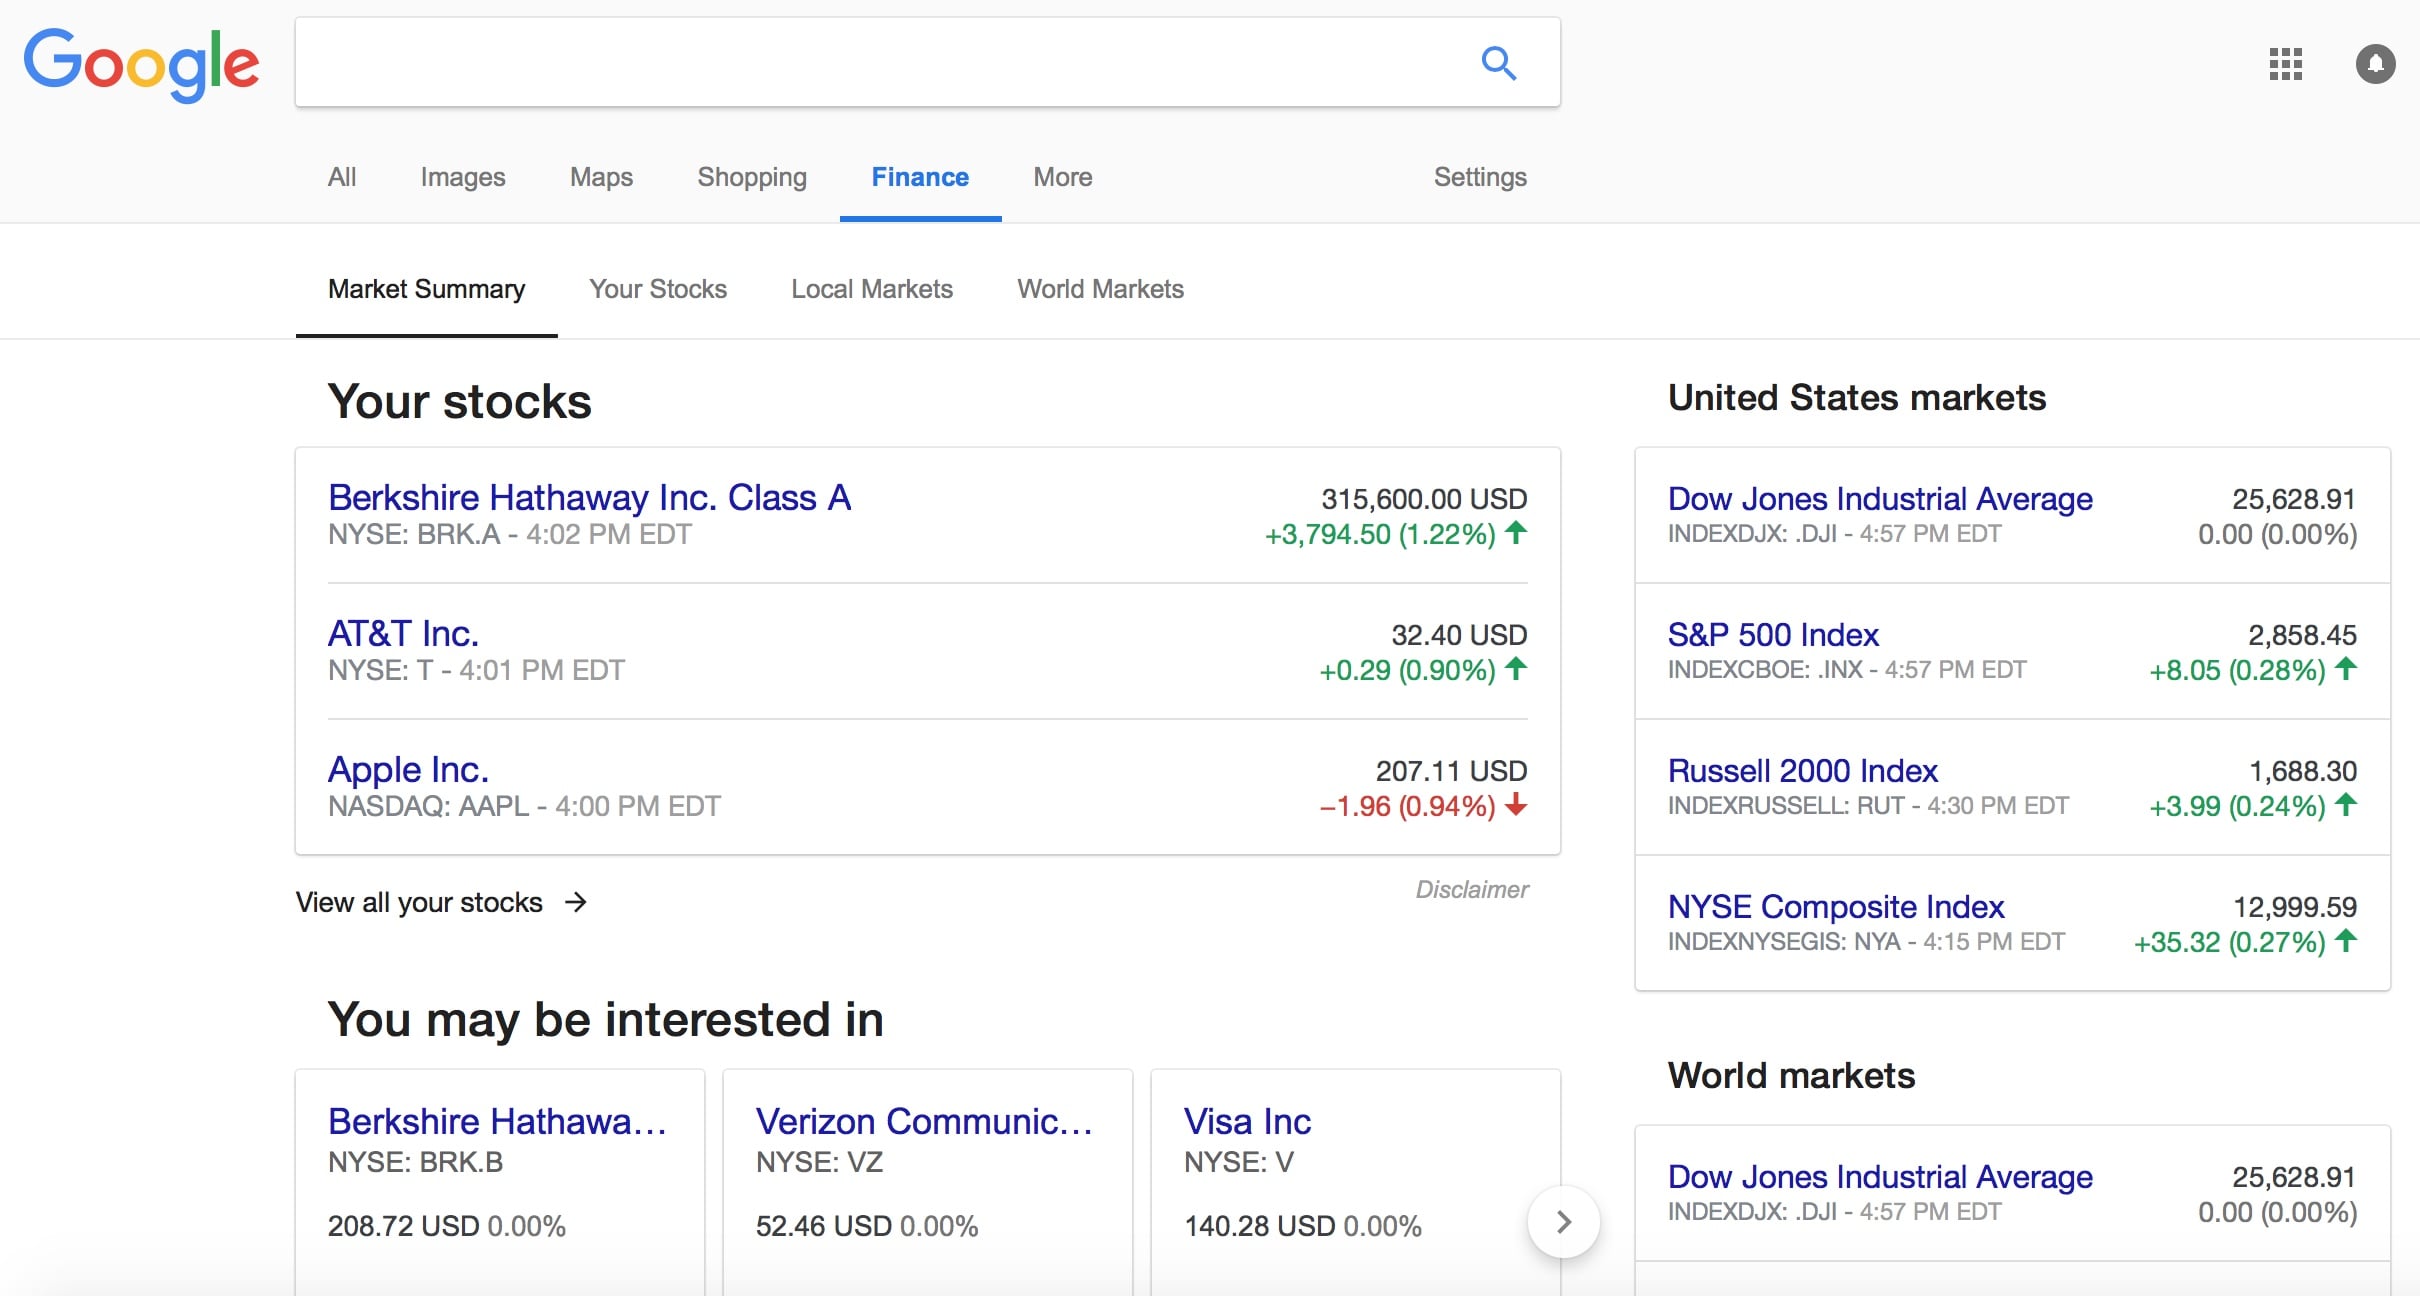
As part of a search engine, Google “remembers” where you’ve been searching so if you were recently looking at articles or stock quotes for a specific company, the top five will be listed on your home page under “Recently searched”. Also, like a search engine, you’ll see a “You may be interested in” section where you will see competitors and other companies that were outside of your top five recently searched.
From there you can click or tap on a specific company and you’ll be taken to another page where you can see a real-time stock quote with information such as:
- Stock open – what the price per share was when the market opened
- Stock high – the highest price per share the security has reached for the day
- Stock low – the lowest price per share the security has reached for the day
- Market cap - a measurement of the company’s size (small-cap, mid-cap, large-cap)
- P/E ratio - a measurement of a company’s stock price (P) in relation to its earnings per share (E)
- Dividend yield – a measurement of the company’s annual dividend divided by the stock’s current market value
- Previous close – what the price per share was when the market closed on the previous trading day
- 52-week high – the highest price per share the stock has reached in the last 12 months (not calendar months)
- 52-week low – the lowest price per share the stock has reached in the last 12 months (not calendar months)
For experienced investors, this is basic information and not much more. They do provide a tab for Financials and here you can get additional information from the company’s last quarterly filing such as:
- Revenue – the amount of money a company has brought in from sales of their goods and services
- Net income – essentially what is a company’s profit after all expenses have been deducted
- Diluted EPS – what a company’s earnings per share would be if all their convertible securities were realized
- Net Profit Margin – the percentage of net income generated from a company’s revenue
- Operating Income – the amount of money a company generates from its operation minus expenses
- Net Change in Cash – how much cash went into or out of a business over a period of time
- Cash on hand – funds that are immediately available to a business and can be used as needed
- Cost of revenue – the total cost of manufacturing and delivering a product or service
There are also tabs that allow users to see this information for the prior three quarters as well. While this is more information than a user would get from the dashboard view, it still leaves out important metrics like outstanding shares, earnings per share and average daily volume.
There are also additional tabs that allow users to compare a stock to its competitors in the sector and also a News tab that provides links to the latest articles from a limited group of major publishers. As you would expect from Google, this is done for search engine optimization (SEO) meaning you get improved quality of the headlines that appear for large companies, but you don’t get the same company-specific news that was available in the previous version. To get a more robust selection of news stories, you’ll need to go back to the “News” tab in Google.
What’s good about the new Google Finance?
Google Finance continues to be available for both desktop and mobile devices and the mobile layout is far superior to the old version. While the information may be truncated within a mobile browser, it is all there. This is a best practice for user experience design and certainly consistent with what you’d expect from a company like Google.
Another good feature of Google Finance is that it once you are in it, you can search for different companies by name or stock symbol. You don’t have to go back out to your dashboard to find information on other stocks in your portfolio.
It also provides beginning investors (or investors who don't want to actively trade) an easy-to-use platform for finding out current information about the stocks, bonds, currencies, and funds that they have an interest or investment in.
What’s different from the old version?
The most notable feature that is missing in this current version is the My Portfolio feature. So although you can follow the stocks that are in your portfolio, the stock information you see will not contain any of your personal information such as keeping track of your number of shares, your cost basis, and a metric that is basic to all portfolios, how much you’ve gained or lost.
Here are some of the other features that are not available in the new version:
- Fundamentals and Company Overviews – As we listed above, the new Google Finance provides basic information about some company information, but the old version included key financial metrics such as trading volume and outstanding shares. It also provided detailed overviews of a company’s business model from independent sources and additional links. The new version does none of this except for an abbreviated Wikipedia description. This is not surprising based on the long-standing relationship between Google and Wikipedia. But not allowing investors access to all available information seems short-sighted.
- Balance Sheets and Cash Flow Statements – In the old version, users could find quarterly balance sheets, income statements, and cash flow statements. Now, as described above, you only see income statements.
- Stock Screening Tool – this allowed users to search for companies based on metrics such as market cap, sector, country, P/E ratio, and dividend ratio to name a few. Investors will use a tool like this to identify possible trading targets. Not a huge loss, but something that was there and no longer is.
- Google Domestic Trends – this was a unique feature that seemed to let Google do what it does best, that is to identify "search traffic across specific sectors of the economy". The reason investors would want this information is to identify how search traffic has changed, allowing them to pick up on emerging or receding trends.
What kind of investor will use Google Finance?
Truthfully, only very passive buy-and-hold investors will find much to get excited about with the new Google Finance. When you look at the information Google has given (which isn’t much) it sounds like they are trying to just make general information about finance and stocks available to the masses. This is not a bad thing.
However, general information about finance and stocks is different from what investors need. Serious investors use research and either fundamental analysis or technical analysis to make their investment decisions.
Investors who use fundamental analysis look at a company’s value from a long-term point of view. They need information about a company’s balance sheet and operations that go beyond just a snapshot of where a stock is at the moment. Google Finance provides some of this information, but not enough.
Traders who employ technical analysis, on the other hand, look at the price movement of a chart to tell them everything they need to know about a stock. The single chart provided on Google Finance does not include key information that technical analysis investors would need, like average daily trading volume.
In short, Google Finance is an information source, but not a research tool for investors.
Why Less is Less
If this were Google's first attempt at providing financial and stock information, it would seem like a passable attempt. There is information there. And, in fairness, some of the old information may eventually come back. Up until earlier this year, Google had provided a workaround for previous users to use the legacy version of Google Finance. That has gone away as well, leaving many users seeking other options. It seems odd that Google would create a version that has less functionality, features, and therefore utility, for many of its users, but that’s what they’ve done.
It seems like they have generally decided to target an audience that is looking for financial news and not for financial information they can use for investing decisions. They may be finding out that the two audiences share more in common than previously thought.
The bottom line on the new Google Finance
The old Google Finance was a standalone portal that provided not only robust information about a stock's current performance but also allowed users to enter their personal portfolio information so they could see its value go up or down. It was not a model of great design, and it needed a refresh. Still, it seems that in an effort to match Google Finance with the rest of the Google user experience, they left off the experience that investors actually need.
I suppose there could be some rationale for Google to not allow personal financial information to be displayed from google.com without providing additional security measures. And maybe those are coming down the road. Google says it is “listening to customer feedback”. Who knows?
Still, there is an expression in sports; never let them see your backup. And with the number of users who are complaining about the new site and choosing to use other sites to get the functionality that the old Google Finance used to offer, it seems that Google will be losing some traffic.
Before you make your next trade, you'll want to hear this.
MarketBeat keeps track of Wall Street's top-rated and best performing research analysts and the stocks they recommend to their clients on a daily basis.
Our team has identified the five stocks that top analysts are quietly whispering to their clients to buy now before the broader market catches on... and none of the big name stocks were on the list.
They believe these five stocks are the five best companies for investors to buy now...
See The Five Stocks Here
The space race is growing fast, and you don’t have to have gotten in early on SpaceX to profit. This report shows seven space stocks you can buy today that may grow as rockets, satellites, defense, space internet, and new space technology become more important.
Get This Free Report
Like this article? Share it with a colleague.
Link copied to clipboard.