By now, you've probably heard of the term "inverted yield curve" mentioned in the news.
Rumblings of potential recessions and impending negative economic aftershocks often accompany it.
An inverted yield curve tends to cause fear among investors and economists. Historically, an inverted yield curve tends to precede an economic recession, but not always.
We'll dive into the inverted yield curve meaning, how to spot it with examples and the ramifications for your investments. By the end of this article, you should be able to understand the headlines about inverted yield curves and explain them to your friends and colleagues like a pro.
What is an Inverted Yield Curve? Inverted Yield Curves Explained
First, let's review "What is a treasury?" and "What is the yield curve?". Treasuries are debt obligations by the federal government or loans to the government. Buyers of treasuries are lending to the U.S. government in exchange for interest.
You may have heard the terms "Treasury bills," "Treasury notes" and "Treasury bonds" and assumed they are the same, but they aren't. Treasury bills, or T-bills, are short-term debt obligations maturing in one year or less. These bonds are sold at a discount and then grow into full value at maturity.
Treasury notes range in maturity from one-year, two-year, five-year, seven-year or 10-year increments. Treasury bonds mature in either 20 years or 30 years. The interest paid on the treasuries is not exactly the same as the yield. The yield is the annualized percentage return, while the interest is the amount of money and percentage of the principal paid to an investor annually.
 Under normal circumstances, a longer-maturity treasury would pay a higher yield than a shorter-maturity treasury due to the time risk factor. This applies when you buy a certificate of deposit (CD) at a bank. You will notice that CDs with longer maturities pay a higher interest rate than those with a shorter maturity (e.g., a two-year CD versus a six-month CD). The additional interest should offset the uncertainty and risks of holding it longer.
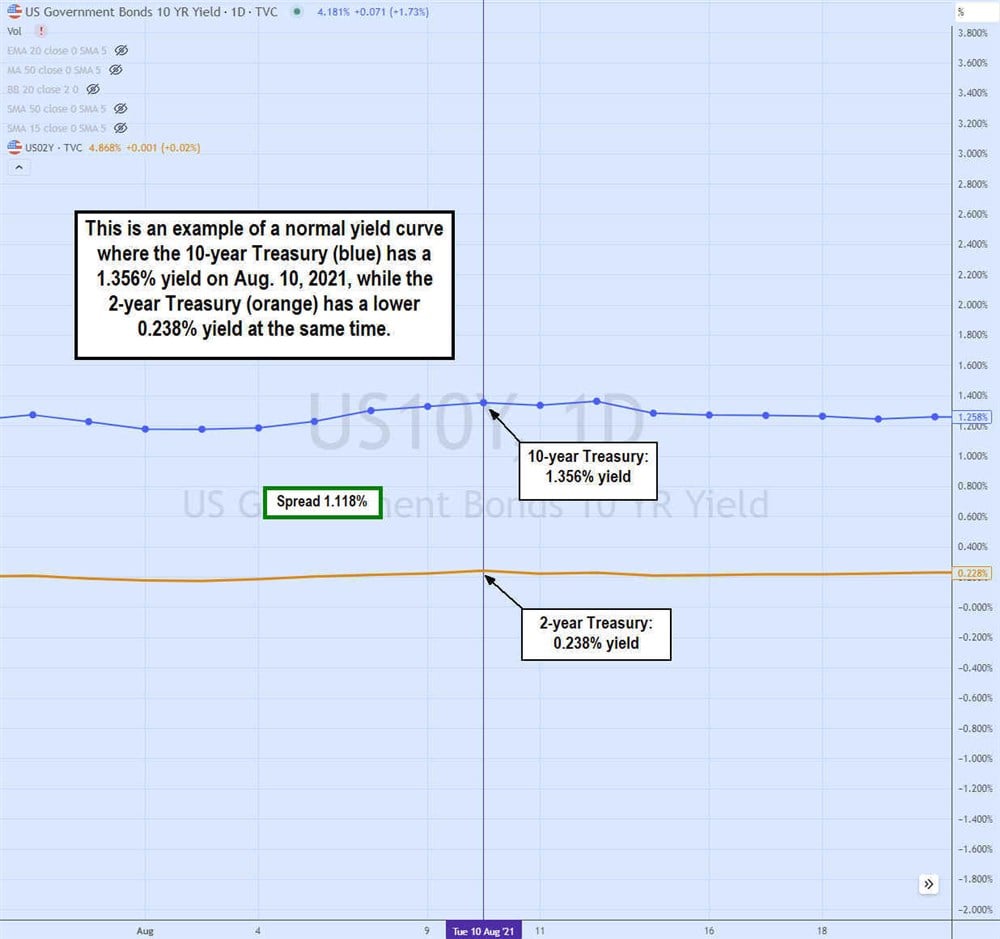
Event and systemic risk is always associated with investing for longer periods. The same applies to treasuries. Longer-maturity treasuries should pay a higher yield than shorter-term treasuries, like a 10-year Treasury paying a 1.356% yield versus a two-year Treasury paying a 0.238% yield on August 10, 2021. This is a normal yield curve. The spread is positive at 1.118%, which confirms the normal yield curve. With each longer maturity, the yield continues to climb.
What is inverted yield curve? What does it mean when the yield curve inverts, exactly?
An inverted yield curve occurs when the opposite happens, where the shorter maturity has a higher yield than the longer-dated maturity. The longer the maturity, the lower the yield goes.
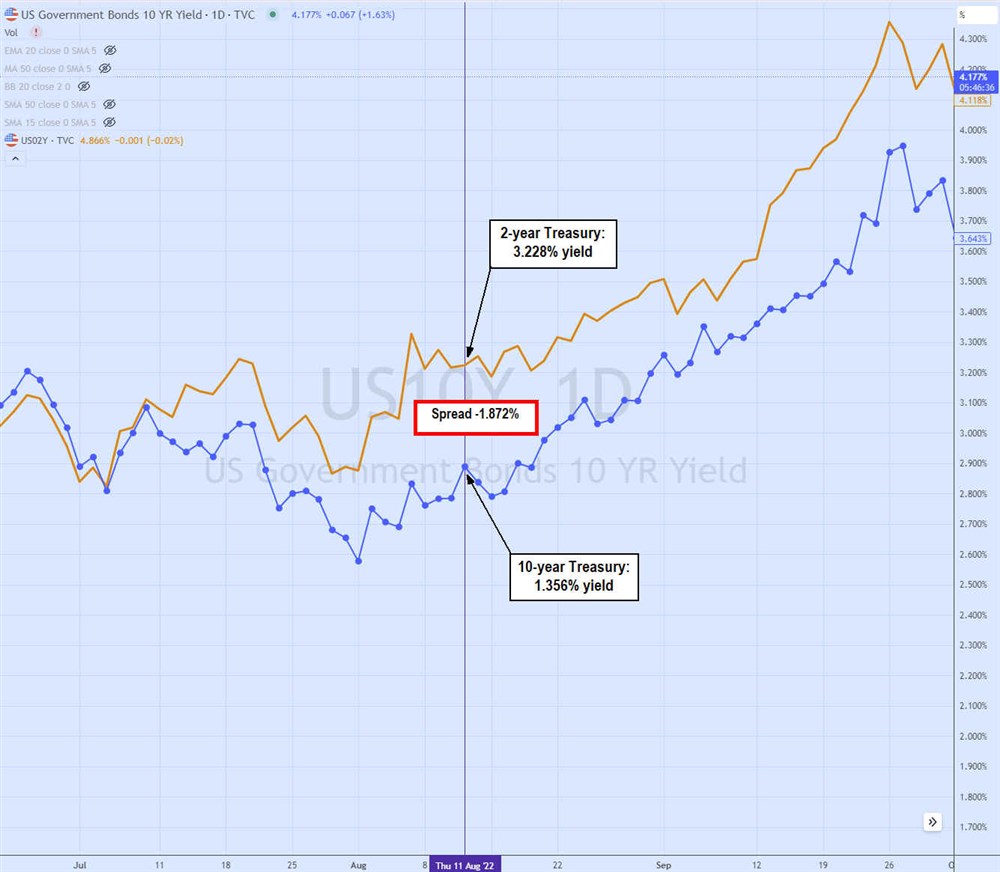
The 10-year versus two-year Treasury daily chart shows an inverted yield curve on August 11, 2022. The two-year Treasury (orange) has a 3.228% yield, higher than the 10-year Treasury yield of 2.890% on the same day. The difference between the 10-year and the two-year Treasury goes negative, indicating an inversion yield curve. The spread between the 10-year and two-year Treasury is -1.872%, confirming the inversion.
What Does an Inverted Yield Curve Mean?
What does inverted yield curve mean? An inverted yield curve occurs when short-term bond yield is higher than long-term bonds. Long-term bonds are riskier than short-term bonds and should be paying a higher yield because of it. When an inverted yield curve forms, it can mean many things.
The most common meaning investors assign to an inverted yield curve is that it's a warning sign of an economic recession. If investors feel a recession is on the horizon, they will jump into long-term bonds disproportionately and drive up prices, which lowers yields. Inverted yield curves have been an accurate predictor of recessions.
They have predicted and preceded 10 recessions since 1955, with a single false positive in the mid-1960s. The time between an inversion and recession has ranged from months to over a year. Not every inversion has led to a recession, as many other factors are involved, so it's more of a warning indicator. What does it mean when a yield curve inverts? Let's find out.
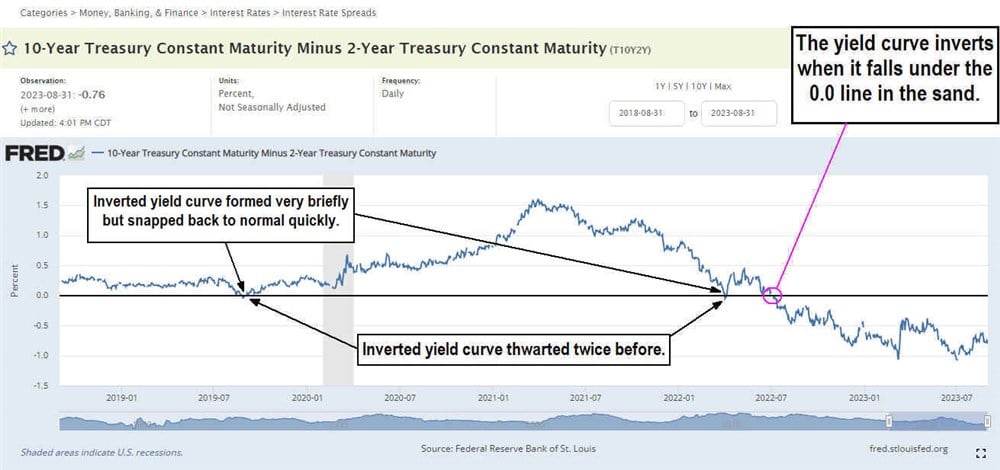
The yield curve briefly inverted in August 2019, preceding a brief recession triggered by the COVID-19 pandemic, an unprecedented anomaly. The economy quickly rebounded, but the yield curve inverted in July 2022 and has remained inverted for over a year through August 2023.
Three Types of Yield Curve
At any given time, three types of yield curves exist.
Normal
A normal yield curve comprises short-term bonds with lower yields that rise as maturity dates get longer. The highest yields will be with the 20-year and 30-year Treasury bonds, while the shortest yields will be with the one-year and lower Treasury bills.
Flat
A flat yield curve forms interest rates on similar short-term and long-term bonds and have small spreads between the yields. The curve is visually flat when plotted on a chart, as the spread between the yields is almost nonexistent.
This tends to occur during a transitional phase when a normal yield curve transforms into an inverse yield curve. It can also occur when an inverse yield curve returns to a normal yield curve. Flat yield curves are especially painful for banks as they can dampen profitability on margins due to the tight spreads between the maturities. Remember that banks borrow at short-term rates to loan out at long-term rates.
Normal and Flat vs. Inverted
The normal and flat yield curves are transitions where a normal yield curve transitions into a flat yield curve that turns into an inverted yield curve. The reverse sequence occurs when an inverted yield curve reverts to a normal yield curve.
These can be considered stages rather than final destinations. Yield curves are dynamic and will always fluctuate. Banks face net interest margin pressure when yield curves invert as the spread also inverts. Banks traditionally borrow from depositors and the central banks at low short-term rates and loan out at higher long-term rates like 30-year mortgages. An inverted yield curve can tighten the spreads or even invert it, which can cause banks to lose money on loans. When this happens, banks have fewer incentives to offer loans.
What Causes a Yield Curve to Invert?
Sentiment is a key drive of the yield curve. A yield curve inversion can form when investors and institutions overwhelmingly and disproportionally buy long-term treasuries, driving down yields.
The question is, what causes the surging demand for long-term treasuries? In most cases, it's due to a risk-off stance where investors seek safety and stability and are willing to sacrifice yield. There are many instances where this can occur:
- Recession fears: Long-term bonds rise in value as yields fall when investors and institutions pour into them, anticipating an economic slowdown. The fear of recession can often be a self-full-filling prophecy. Investors taking proactive measures like buying long-term treasuries or swapping out short-term notes with long-term treasury bonds can lend toward yield curve inversion.
- Geopolitical risk: Any geopolitical event that causes an inflow into long-term government bonds can trigger an inversion. Other nations that may feel their interest rates are too low may swap into U.S. Treasury bonds, causing the yield to fall.
- Central bank actions: Fed monetary tightening policy actions like raising short-term interest rates can cause a yield curve inversion. The Fed can raise interest rates to combat inflation and slow the economy from overheating. A tightening monetary policy where the Fed raises short-term interest rates to combat inflation and cool down an overheated economy can also cause an inverted yield curve. The aggressive rate hikes implemented by the Fed in 2022 led to an inverted yield curve.
- Flight to safety: Domestic and international investors may seek safety and stability due to market or geopolitical volatility. They may buy up 20-year and 30-year Treasury bonds to cause values to rise while yields fall. Bond prices and yields have an inverse relationship. A flight to quality where investors seek to take off risk and buy long-term treasuries can also lend to an inverted yield curve as buying demand causes yields to fall.
How Long Before a Recession Does an Inverted Yield Curve Appear?
Historically, a recession has occurred from months to over a year after the yield curve inverted. It's hard, if not impossible, to predict with much certainty the exact time it will occur. Remember that a recession refers to a significant economic decline and a business cycle contraction.
Technically, a recession is two consecutive quarters of negative gross domestic product (GDP) growth. Other factors like rising unemployment levels, contracting income and manufacturing and falling retail sales all lend to a contracting business cycle. A falling stock market or a bear market is also associated with recessions. The National Bureau of Economic Research (NBER) determines the official starting and ending dates of U.S. recessions which expects more than two months of falling GDP to declare a recession officially.
Historical Examples of Inverted Yield Curves
There are many examples of inverted yield curves leading to recessions in history. The inverted yield curve from December 1969 to March 1970 ushered in a recession. The 1974 recession followed the inverted yield curve from September 1974 through July 1975. The recession of 1982 followed the October 1981 to July 1982 inverted yield curve.
The February 1998 yield curve inversion through July 1999 was not followed immediately by a recession, but the internet bubble of 2020 and stock market meltdown did occur afterward. The NBER declared a U.S. recession from March 2001 to November 2001. The June 2007 inverted yield curve preceded the recession of 2008 and the financial meltdown as stock market indexes lost more than 50% off their highs.
What to Do When You See a Yield Curve Inversion
When you see an inverted yield curve, it can signify an impending recession. In those situations, it's better to be safe than sorry. Prepare yourself for the possibility of a recession. Stay abreast of economic reports like GDP and indicators like unemployment filings and jobs reports.
Consider rebalancing your portfolio by selling risky assets in exchange for fixed-income instruments like bonds, CDs and money market accounts. Also, consider having emergency funds saved and ready and accessible. If changing careers, consider a career in a recession-proof industry. Take comfort in knowing that the U.S. economy has recovered and expanded after every recession and every bear market.
Recession-Proof Industries
Recessions are an inevitability. Just as the business cycle expands, it also contracts, which is when recessions occur. While most industries will get hit when a recession occurs, three industries tend to weather them consistently for logical reasons. The three recession-proof industries are government, education and healthcare. These are the consumer staples of industries as they are essential to a modern civilized society. History shows that the government continues to spend and hire even throughout recessions.
Military spending is recession-proof, especially amid geopolitical tensions or events. The education sector of schools and universities continues to grow and expand as students need to attain their degrees regardless of a recession. Healthcare is a necessity that everyone needs regardless of an expanding or contracting economy. The aging population dictates that healthcare is a recession-proof industry as costs continue to rise as more people every year gain Medicare benefits.
Before you make your next trade, you'll want to hear this.
MarketBeat keeps track of Wall Street's top-rated and best performing research analysts and the stocks they recommend to their clients on a daily basis.
Our team has identified the five stocks that top analysts are quietly whispering to their clients to buy now before the broader market catches on... and none of the big name stocks were on the list.
They believe these five stocks are the five best companies for investors to buy now...
See The Five Stocks Here
Discover the next wave of investment opportunities with our report, 7 Stocks That Will Be Magnificent in 2025. Explore companies poised to replicate the growth, innovation, and value creation of the tech giants dominating today's markets.
Get This Free Report
Like this article? Share it with a colleague.
Link copied to clipboard.