For most investors, longevity is the primary concern when selecting assets for inclusion in their portfolio. Investors want to choose companies that can survive the long haul, generating profits from their investments efficiently and consistently.
The return on assets ratio formula is a financial metric that you can use to calculate a company's profitability compared to assets. But what does ROA mean for investors, and what is a “good” ratio to look for?
Read on to learn how to calculate return on assets from the ROA formula and how these numbers can be useful for investors.
What is the Return on Assets Ratio?
What is ROA? A company’s return on assets ratio is a figure that describes how much profit a company can produce relative to its corporate assets. In other words, it describes how efficiently a company can use the supply of resources that it holds to generate additional profit. This figure moves beyond data associated with profit and revenue and looks at whether or not a company is expending its resources efficiently for shareholders.
In theory, it makes sense that the more money a business generates in revenue, the more profitable it will be and the better suited for long-term success. However, it’s possible and relatively common for a company to generate significant revenue but remain unprofitable due to its operating expenses. Even if a company is profitable, there may be competitors that are producing less revenue but are more efficiently using its assets.
This can make it helpful to look at the return on total assets ratio formula rather than the revenue formula, particularly when looking for growth stocks. Focusing on companies that can most efficiently produce profit from assets (rather than companies currently at the top in terms of revenue or total market capitalization) may provide you with the opportunity to get in earlier with companies showcasing great management teams. In some industries, this may allow you to get in earlier with companies with a lower initial stock price and a great business model. The return on assets of a company can also be useful in determining if a stock is undervalued enough to qualify as a value stock.
Learning how to compute return on assets starts with understanding the ROA formula. ROA calculation begins with the following formula.
Return on Assets = Net Income / Total Average Assets
- Return on assets: The income a company can generate from its current average assets, calculated over a certain period.
- Net income: A business’s net income equals its total income minus the cost of goods sold (COGS) and other expenses such as rent, payroll, equipment, advertising and taxes. When you complete your return on assets calculation, you can find the most recent net income figure on the company’s income statement. Note that the net income figure is not identical to the “retained earnings” figure found on most corporate balance sheets — a commonly confused but similar figure.
- Total average assets: The total average assets is a figure measured in dollars that describes the average amount of capital a company held over a predefined period. According to the ROA definition, the period used to calculate the average assets must be the same as the period used in the net income calculation. It can be easier to base your calculation period primarily on net income, retrieved per quarter from a company’s income statement.
Remember to use total average assets in your calculation, rather than the assets the company held directly when the net income was recorded. The average assets held is calculated by adding the amount of assets a company had at the beginning of the measuring period with the total assets at the end, then dividing by two.
For example, the ABC Company started its fiscal year with $350,000 in total assets and ended with $370,000 total assets. Its average assets would be $360,000 ($350,000 plus $370,000, divided by 2). While you should follow this general rule, using simplified ROA can also be beneficial when comparing multiple companies quickly.
Most analysts use the total average assets in their calculation rather than the total assets held when net income is recorded because corporate assets can fluctuate over time. Using the average is an attempt to smooth out these fluctuations to get a more accurate picture of a company's total asset base.
How to Calculate ROA
Let’s look at an example of how the formula for return on assets ratio might work using a practical and easy-to-understand example.
Imagine that there are two competing makeup companies, Company A and Company B. Company A creates a barebones operation and focuses primarily on its ingredients, while Company B spends more capital on marketing research and creating appealing packaging designs. By the time they both enter the market from the development stage, Company A has spent $2,000, and Company B has spent $8,000.
After a predetermined period in the market, it’s time to calculate profits and look at simplified ROA. Company A has produced $600 in profits, while Company B returns $1,200. ROA calculations for each company are thus as follows:
- Company A ROA: $600/$2,000 = 30%
- Company B ROA: $1,200/$8,000 = 15%
This calculation is an example of what return on assets means when looking beyond pure revenue when evaluating which companies are the most efficient additions to your portfolio. While Company B produced twice the amount of profit as Company A, it needed to expend a significant amount of resources to achieve this rate of return.
Though Company A's income was lower, it produced funds twice as efficiently as Company B because its initial investment was lower.
What is a Good Return on Assets Ratio?
What is a good return on total assets ratio, and what ratio should you look for when evaluating stocks? Generally, an ROA of 5% is good, while a ratio of 20% is great.
As with other types of financial ratios, it's less valuable to look at the ROA of different companies individually than to compare them against other companies within the same industry. When looking at a single company, there can be many reasons for income to change from year to year. If an investor assigns too much value to a single year, good or bad, it can cause them to misjudge a company's financial strength or weakness.
You should also compare the return on asset ratios between companies operating within the same industry because different industries use assets differently. Banks, for example, have far fewer capital intensive assets than construction companies because they will invest primarily in intangible assets. This can make ROA a more important factor in industries that are more likely to need to invest heavily in capital assets as a nature of the industry. After investing in a company, monitor how its ROA is changing over time to ensure it can maintain its competitive edge.
Why is Return on Assets Important?
ROA may provide unique insights into the profit a company can generate and how it utilizes its assets to do so. By comparing ROA data, you may gain insight into the following areas:
- Profit generation efficiency: ROA measures how well a company can generate profits from its total assets, further indicating the effectiveness of a company's management in using its resources to generate earnings. A higher ROA suggests the company may be more efficient at generating profits relative to its held asset base.
- Corporate efficiency comparison: ROA can allow you to compare the efficiency of different companies within the same industry. By comparing the ROA of multiple companies operating within the same sector, investors can identify which ones are better at utilizing their assets to generate profits. This comparison can aid in making investment decisions for the long term, allowing you to select companies that remain efficient at using available resources.
- Insight into company performance trends: Monitoring ROA over time can help you track a company's performance trends. For example, a consistent or improving ROA might signal effective management and sustainable profitability. Conversely, a declining ROA could indicate deteriorating asset utilization or operational inefficiencies that need attention.
As each of these points suggests, ROA is most effectively used in conjunction with other corporate data or in comparison to past data points.
Return on Assets (ROA) vs. Return on Equity (ROE)
When learning how to find return on assets, it’s also important to understand return on equity (ROE) and how this figure varies from the former. While ROA measures how efficiently a company generates profits from its total assets, ROE focuses on showcasing how much return shareholders specifically are seeing on their investment. The formula for ROE calculation is as follows:
Return on Equity = Net Income / Shareholders' Equity
- Return on equity: The return generated for investors based on the company's total net income over a given period.
- Shareholder equity: The shareholders’ equity is the residual interest in a company's assets after deducting its liabilities. You can calculate shareholders’ equity by subtracting the company's total liabilities from its total assets. After accounting for all debts and obligations, this provides a snapshot of the residual value that belongs to the shareholders.
The bottom line? While ROA and ROE can be important financial figures, they focus on different aspects of a company's returns. ROA summarizes overall operation efficiency, while ROE is a summary of how efficient a company is in specifically returning profit and equity to those who own shares in the company.
Example of Calculating Return on Assets
To learn more about ROAs, let’s look at companies within the healthcare sector using simplified ROA comparisons. UnitedHealth Group NYSE: UNH, one of the largest companies within the sector, currently showcases a total asset holding of about $246 billion.
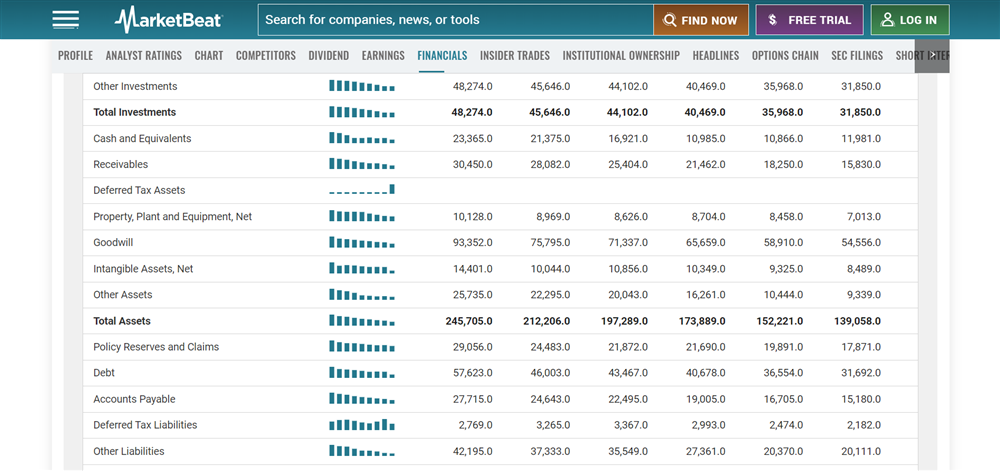
UnitedHealthcare showed a net income of $20.12 billion in the previous fiscal quarter.
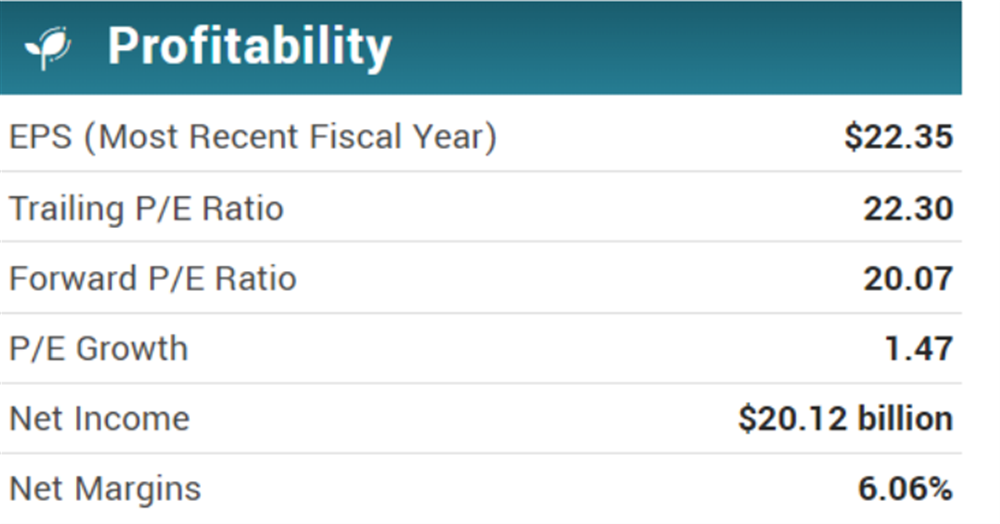
To calculate the simplified ROA, you would divide the net income ($20.12 billion) by the total assets held by the company during the shared calculation period ($246 billion). In this example, the ROA for UnitedHealthcare stock was 8.18% in August 2023.
Remember that ROAs are most useful when examined with additional company data within the same sector. The Cigna Group NYSE: CI is another major insurance provider offering healthcare coverage in the United States and a competitor of UnitedHealthcare. Recent company data indicates that the Cigna Group's total assets were $150 billion in 2023. It showed a net income of $6.67 billion.
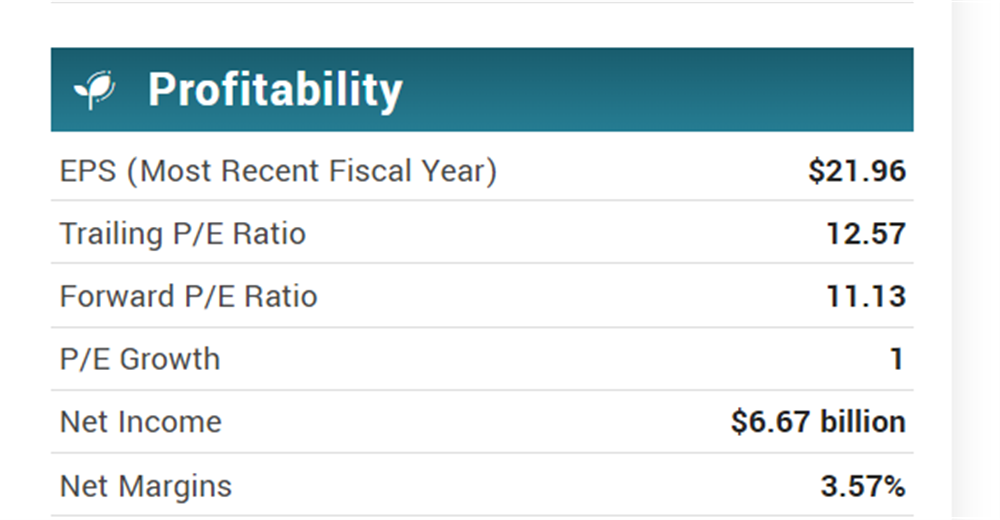
To calculate ROA, we must divide the net income by the total assets held using the same formula as the calculation above. In August 2023, the Cigna Group showed a total ROA of 4.45%. This figure tells investors that, when compared to UnitedHealthcare, The Cigna Group may be less efficient at using its held resources to generate profit.
Using Return on Assets Data as an Investor
While ROA data can be a useful comparison tool for choosing between investment options in a single sector, it does have its limitations. For example, because the ROA formula includes short- and long-term assets, intangible assets (like trademarks and patents) are not considered assets under traditional accounting rules. A company that relies on these intangibles may report fewer assets, and their ROA will be artificially higher, but may not reflect their ability to use profits from assets.
Considering this, use ROA and other data to select your investments. Monitor how your investments' ROAs change over time to be sure that companies can maintain their efficiencies as the market changes.
Before you make your next trade, you'll want to hear this.
MarketBeat keeps track of Wall Street's top-rated and best performing research analysts and the stocks they recommend to their clients on a daily basis.
Our team has identified the five stocks that top analysts are quietly whispering to their clients to buy now before the broader market catches on... and none of the big name stocks were on the list.
They believe these five stocks are the five best companies for investors to buy now...
See The Five Stocks Here
The space race is growing fast, and you don’t have to have gotten in early on SpaceX to profit. This report shows seven space stocks you can buy today that may grow as rockets, satellites, defense, space internet, and new space technology become more important.
Get This Free Report
Like this article? Share it with a colleague.
Link copied to clipboard.