What is a head and shoulders pattern and how does it work? Head and shoulders chart patterns are found in all asset classes and tend to repeat themselves. It's a pattern that can be part of a trading or investing strategy. They are reversal patterns signaling the end of an uptrend.
Knowing this information prepares you for potential entries or exits. We will explore how to spot a head and shoulder formation and use a head and shoulders pattern with our step-by-step guide.
What is a Head and Shoulders Pattern?
If you've ever wondered, "What is a head and shoulders stock pattern?" it's a simple formation you can spot on a candlestick, line and bar chart in any time frame.
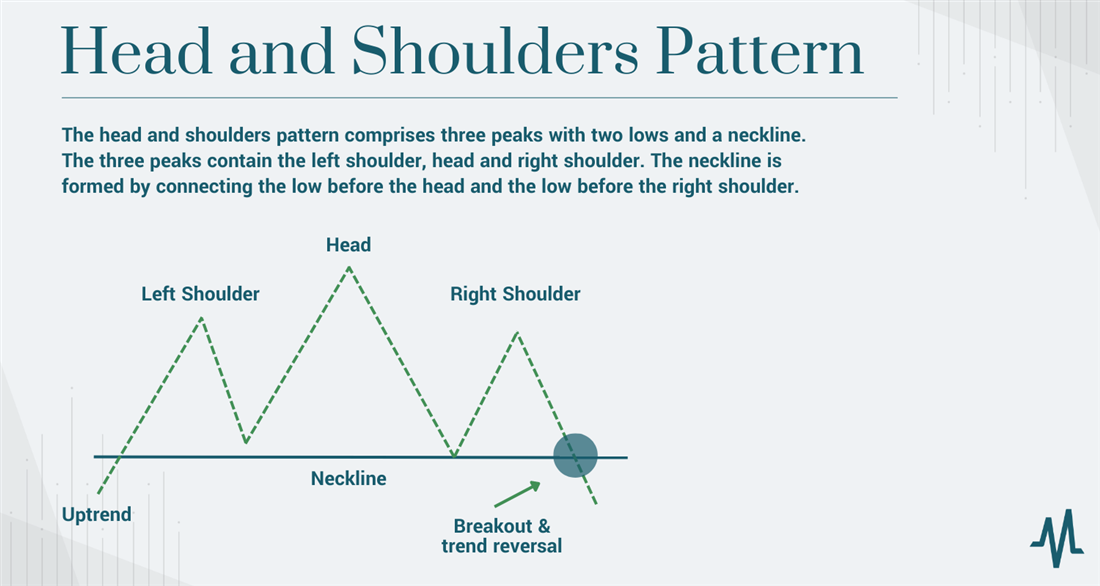
Its pattern comprises three peaks with two lows and a neckline. The three peaks contain the left shoulder, head and right shoulder. The neckline is formed by connecting the low before the head and the low before the right shoulder. The pattern develops near the end of an uptrend and can trigger a breakdown and subsequent downtrend. Many times, the technical pattern will precede news, economic reports or upgrades or proceed after events like earnings releases.
A head and shoulder pattern needs to come at the end of an uptrend, meaning there must be an uptrend preceding the left shoulder so there is a trend to reverse. A head and shoulders top indicates an uptrend's potential reversal and breakdown. This information can be very useful. If you have long positions in head and shoulders pattern stocks, you should consider having stop-losses in place in the event of a trend reversal. A breakdown through the neckline usually triggers the trend reversal and the start of a downtrend.
A head and shoulders stock formation involves buyers chasing a stock to a new swing high at the left shoulder and then a pullback to a low point to start the neckline. More buyers come in as interest peaks and volume spikes taking the stock head and shoulders to a new high after surpassing the left shoulder. This new high is the formation of the head. Shares sell off again to a low point before bouncing again as buyers who chase it high hope to get back to even. There aren't many new buyers this time so the rally peaks out below the head level forming the right shoulder. The two low points are connected to form a neckline. As the stock fades and continues to sell off, it breaks down through the neckline as a downtrend reverses the uptrend.
Parts of the Head and Shoulders Pattern
Let's look at the parts of a head and shoulders pattern to chart head and shoulders. There are three distinct parts in head and shoulders technical analysis.
Left Shoulder
The left shoulder is formed at the peak of the uptrend as it takes a pullback from profit-taking and selling pressure. The pullback usually doesn't fall down through the current uptrend line. The low point of this pullback marks the start of the neckline. Buys come back into the stock as selling pressure dissipates.
Head
The stock bounces from the low point of the pullback from the left shoulder. Buyers come back into the stock with even more gusto. Shares rise to and through the peak of the left shoulder, making a higher high. Eventually, the stock will make a peak which is the head.
Shares will fall back under the left shoulder price level and continue selling off to another low point. The low point can be higher than the first low point. If the low point is equal to the first low point, a double bottom may form.
Right Shoulder
The sell-off from the head level shook out a lot of longs as they get nervous, fearing the uptrend is over. However, buying comes back into the stock again. Shares spike up to or through the left shoulder peak level but don't reach the head level. The stock makes a low high (than the head) as it loses steam. This starts to concern bulls as shares fall back down to the neckline.
Neckline
The neckline is the support level. It was created by connecting the low of the left shoulder and the low of the head. Drawing a trendline from the first low point through the second low point creates the neck line. This line is where the stock had previously bounced off of. As the selling builds steam, the neckline gets tested and eventually breaks. That signals the end of the uptrend and a reversal breakdown forming a downtrend.
How Does the Head and Shoulders Pattern Work?
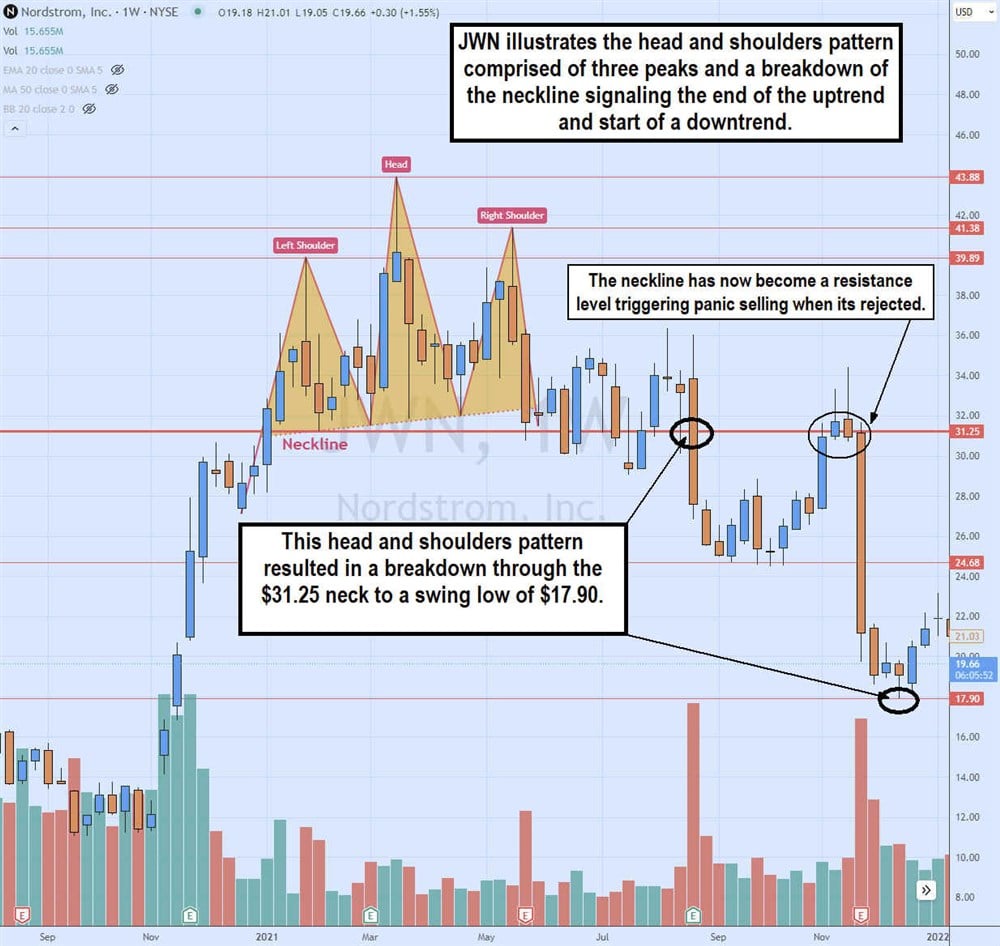
The head and shoulders pattern reverses the trend and sentiment in the stock from bullish uptrend to bearish downtrend. The breakdown through the neckline is the confirmation of the reversal.
As shares fall lower, more panic ensues as the sentiment turns bearish. This can result in large red candles as anyone who bought shares above the neckline fall further underwater. The neckline, which was previously support, now becomes a resistance price level as panic selling ensues when it can't retake the neckline.
Inverse Head and Shoulders
What is an inverse head and shoulders pattern? Chart patterns are linear. What works in an uptrend should also work in a downtrend. A strong breakout pattern can be a strong breakdown pattern just by inverting it.
What is a reverse head and shoulders pattern? While head and shoulders are bearish reversal patterns on an uptrend, a reverse head and shoulders pattern is a bullish reversal on downtrends.
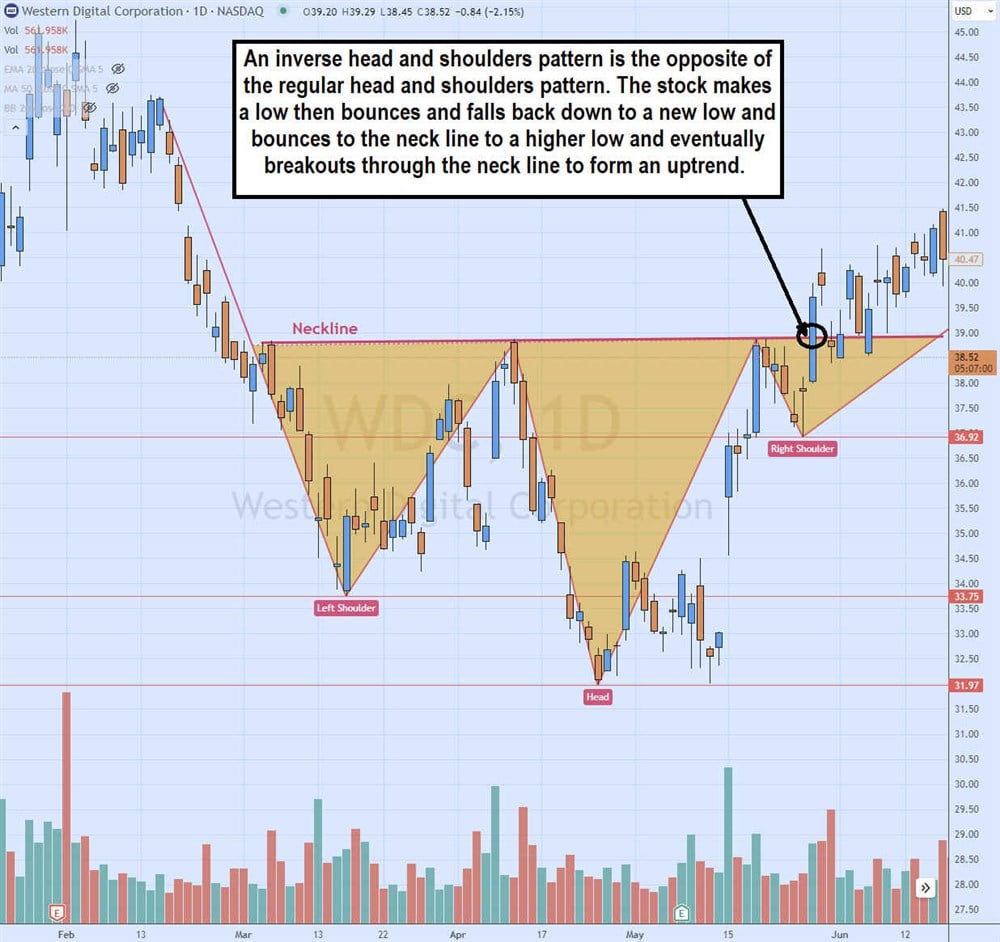
Inverse head and shoulders patterns include reverse head and shoulders patterns. An inverse head and shoulders bottom formation has three downside peaks (or valleys) and a neckline. It's literally like taking a head and shoulders pattern and turning it upside down. Rather than peaks, they are now valleys. The neckline breakout signals the reversal of the downtrend into an uptrend. The same rules apply but just in reverse.
How to Use the Head and Shoulders Pattern
Here’s a four-step process for using a head and shoulders pattern and understanding further, "what does a head and shoulders pattern mean?"
Step 1: Spot the pattern.
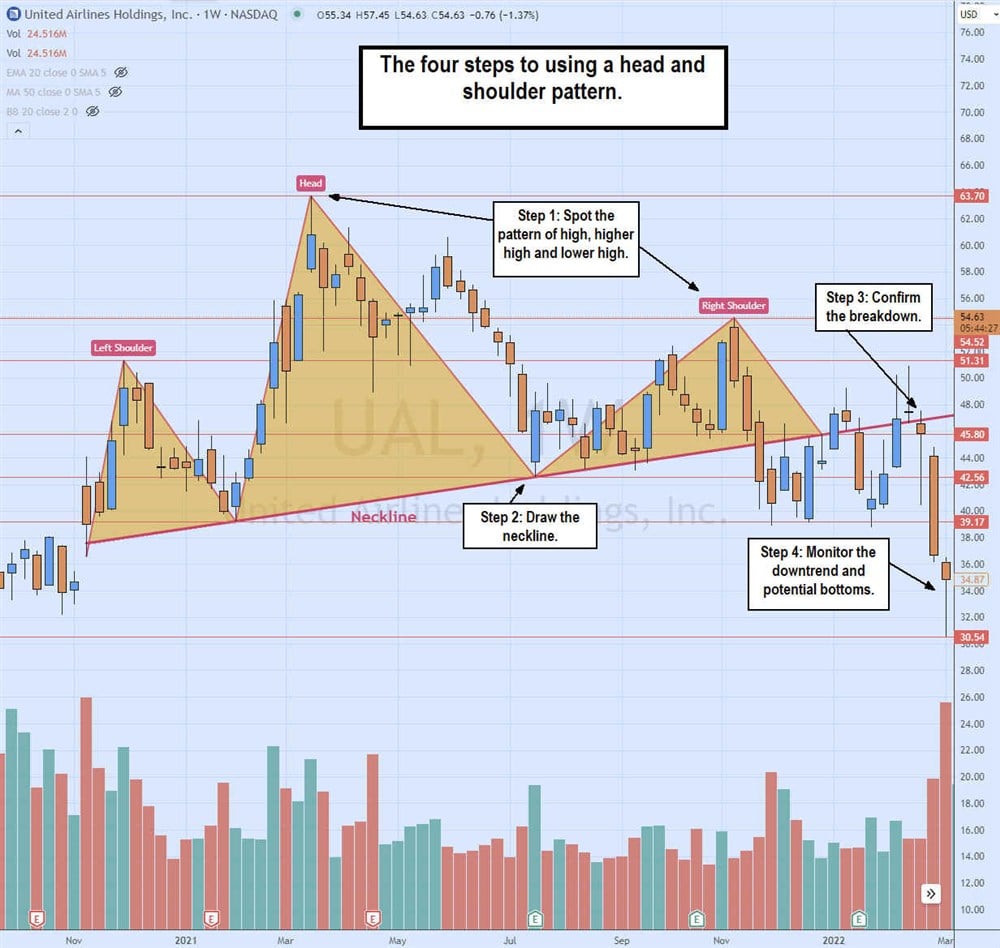
Look through a basket of stock charts or use a screener if you can access one. Manually filter through the charts. Look for an uptrend that forms a high, falls and bounces to a higher high, falls and bounces to a lower high. That's the basic head and shoulders pattern.
Use chart drawing tools so you can label the chart. Make sure you identify the three peaks starting with the left shoulder, head and right shoulder. Connect the lows of the left shoulder through the low of the head. This will be your neckline to determine if the breakdown is for real.
Step 3: Confirm the breakdown.
After forming the right shoulder, pay attention to how the stock reacts to the neckline. When the stock falls under the neckline, it may wiggle and chop around initially, but the breakdown is confirmed when reversion attempts are rejected. The rejection doesn't have to be on the nose, but the candle body should be under the neckline. The breakdown can feel like a rug pull, which causes more panic selling.
Targets can come from many different methods. The expected target on a head and shoulders breakdown is the amount of the drop from the high of the head to the neckline. This is just a general expectation and should be assumed will happen. It's best to utilize other chart indicators like Bollinger Bands and relative strength index (RSI) to measure the price and momentum of the target.
Step 4: Monitor the downtrend.
As the downtrend gains steam, stay on your toes for a sign of a bottom. These can be rounding bottoms that slowly base and turn back up, or capitulation bottoms where a sharp lower low forms with a doji or hammer candlestick. When the tails are more than three times the size of the body, then it's time to pay attention to a possible reversal. This implies that the final sellers holding out for a bounce had finally thrown in the towel, often at the lows. New buyers enter the stock at a seemingly bargain price if a lower low isn't formed.
Example of Using Head and Shoulders
Let's take an example of a head and shoulders breakdown using the cryptocurrency exchange stock Coinbase Global Inc. NASDAQ: COIN.
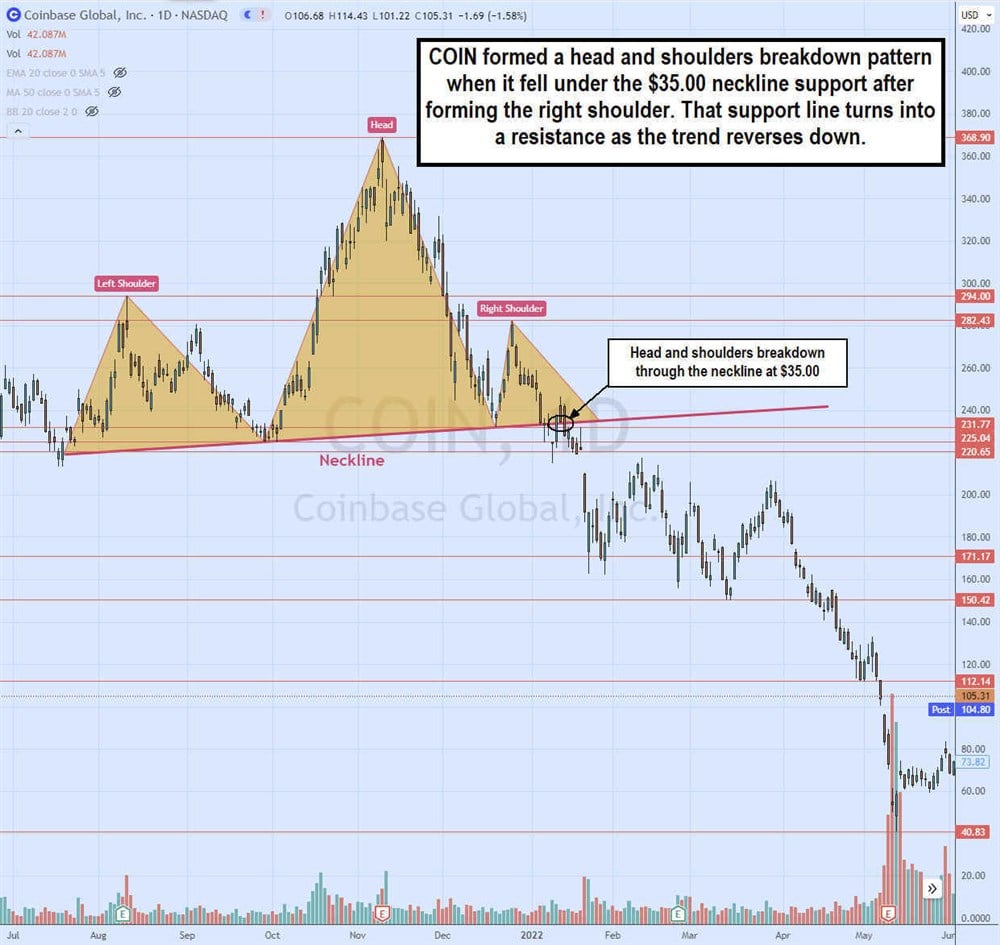
The COIN daily candlestick chart illustrates a head and shoulders breakdown. The daily candlestick chart shows the left shoulder peaked at $294 and pulled back to $225.04 to start the neckline. COIN bounced off the neckline and accelerated through the left shoulder level at $294 and continued to make a higher high of $368.90 as analysts upgraded shares.
Shares turned down and accelerated to the downside falling to a low of $231.77, completing the neckline. The neckline can now be drawn by connecting the first low and the second low candles. COIN bounced off the neckline again to climb to a high of $282.43 before losing steam and falling through the neckline around $235, which could be used as a short sell signal. Shares collapsed making a series of lower lows and eventually falling to $40.83.
Pros and Cons of the Head and Shoulders Pattern
Here are some pros and cons of head and shoulders patterns to be aware of.
Pros
Here are the positives of head and shoulders patterns.
- Linear chart pattern: Head and shoulders patterns work on all time frame charts and all financial tradeable asset classes. Forex traders very often use head and shoulders patterns to assess trend reversals just as stock traders do. The linear pattern nature makes charting head and shoulders on various trading instruments easier. You can find head and shoulders patterns in blue-chip and penny stocks.
- Easy to recognize: The head and shoulders is a classic and non-complicated pattern you can quickly identify. It becomes easier to spot once you train your eyes to look for the new high, higher-high and lower-high peaks.
- Predictive power: A confirmed head and shoulders pattern sets up a breakdown and often extended downtrend because there are three peaks worth of buyers now underwater with their stock. The lower shares fall, the more nervous they become and panic out of their positions.
Cons
Here are the negatives of head and shoulders patterns:
- Laggard signal: A head and shoulders pattern looks great in the rearview mirror after it's formed, but it can be a late signal when the breakdown is confirmed. While a solid head and shoulders pattern will generate an extensive downtrend, it's all about where you enter a position. Some traders will use the neckline as a trail stop on short sells.
- Subjective identification: The head and shoulders pattern can sometimes be subjective. While the new high, higher-high and low-high pattern seems simple enough, the pattern may be more effective using a different peak for a better neckline. Just like making trendline and drawing-based patterns, everything relies on where you start and stop your plots.
- Head fakes before confirmation: Head and shoulders patterns can cause traders to jump in too quickly and get chopped around as the stock bounces up and down through the neckline. Eventually, the bounces get cut off at the neckline as the downtrend takes shape, but this can be after many head fakes. Multiple time frames and additional chart indicators can narrow the number of head fakes and false signals.
Combine with Chart Indicators for Best Results
Price and momentum indicators can provide more color to your head and shoulders chart. Consider utilizing a price indicator like Bollinger Bands or moving averages to visualize the range and dynamic price support levels. Add a momentum indicator like the relative strength index (RSI) or stochastic to gauge the overbought or oversold condition of the stock before and after the neckline break.
If you're trading with head and shoulders patterns, it's best to experiment with different chart indicators to help get better triggers. Utilizing multiple time frames can help your entries and exits when charting head and shoulders. Use a smaller time frame chart to get earlier signals. For example, if you spot the head and shoulders pattern on the daily candlestick chart, use intraday times frames like the five-minute and 15-minute candlestick charts to determine entries and exits. Be aware that shorter time frame charts can generate early signals, but they can also be false signals. For this reason, swing traders use the larger time frame to avoid the noise and chop surrounding the pattern.
FAQs
Here are some answers to frequently asked questions about "What is a head and shoulders pattern for stocks?"
What does a head and shoulders pattern tell you?
What is a head and shoulders pattern for stocks, and what does it tell you, exactly? Great question. A head and shoulders is a trend reversal pattern. It alerts you that the uptrend is ending and a breakdown and subsequent downtrend is forming. It can be a signal to exit long positions or enter short positions.
What is the opposite of a head and shoulders pattern?
The inverse head and shoulders or reverse head and shoulders pattern is the opposite of the regular head and shoulders pattern. The regular pattern is a bearish reversal pattern triggering the breakdown of an uptrend. An inverse head and shoulders is a bullish pattern that signals the reversal of a downtrend.
Is head and shoulders bullish or bearish?
A head and shoulders pattern is bearish as a trend reversal pattern. An inverse head and shoulders is bullish as it signals the reversal of the downtrend.
How accurate is the head and shoulders pattern?
After the fact, they are 100% accurate. The dilemma is that it can be difficult to enter the trade so late when the head and shoulders pattern is clearly identified after its formation, and the breakdown ensues. The accuracy of the head and shoulders pattern as it develops depends on what chart indicators and trading methodology you are using for the entry and exit signals.
Before you consider Coinbase Global, you'll want to hear this.
MarketBeat keeps track of Wall Street's top-rated and best performing research analysts and the stocks they recommend to their clients on a daily basis. MarketBeat has identified the five stocks that top analysts are quietly whispering to their clients to buy now before the broader market catches on... and Coinbase Global wasn't on the list.
While Coinbase Global currently has a Hold rating among analysts, top-rated analysts believe these five stocks are better buys.
View The Five Stocks Here
Tesla, Nvidia, and Google helped shape the last era of market growth, but the next wave could come from a new group of companies. Inside this report, you’ll find 7 stocks that could play a major role in the next tech-driven market boom.
Get This Free Report
Like this article? Share it with a colleague.
Link copied to clipboard.