Bruker (NASDAQ:BRKR - Get Free Report) updated its FY 2025 earnings guidance on Wednesday. The company provided EPS guidance of 2.400-2.480 for the period, compared to the consensus EPS estimate of 2.630. The company issued revenue guidance of $3.5 billion-$3.6 billion, compared to the consensus revenue estimate of $3.5 billion.
Analyst Upgrades and Downgrades
Several research analysts have recently issued reports on BRKR shares. The Goldman Sachs Group lowered their price target on shares of Bruker from $50.00 to $45.00 and set a "neutral" rating for the company in a report on Thursday. Citigroup lowered their target price on Bruker from $75.00 to $50.00 and set a "buy" rating for the company in a report on Monday, April 7th. Wells Fargo & Company reduced their price target on Bruker from $75.00 to $60.00 and set an "overweight" rating on the stock in a report on Thursday, April 17th. UBS Group dropped their price objective on shares of Bruker from $57.00 to $45.00 and set a "neutral" rating for the company in a report on Thursday. Finally, Guggenheim reissued a "buy" rating on shares of Bruker in a report on Monday, February 24th. Six investment analysts have rated the stock with a hold rating and six have given a buy rating to the stock. According to MarketBeat, the company presently has an average rating of "Moderate Buy" and an average price target of $60.10.
Read Our Latest Stock Report on Bruker
Bruker Trading Down 6.7 %
BRKR traded down $2.72 during trading on Friday, reaching $37.79. 4,239,535 shares of the stock traded hands, compared to its average volume of 1,564,102. The company has a quick ratio of 0.77, a current ratio of 1.60 and a debt-to-equity ratio of 1.15. The stock's 50-day moving average is $41.26 and its 200 day moving average is $51.21. Bruker has a 12 month low of $34.10 and a 12 month high of $79.78. The stock has a market capitalization of $5.73 billion, a PE ratio of 49.72, a P/E/G ratio of 2.16 and a beta of 1.23.
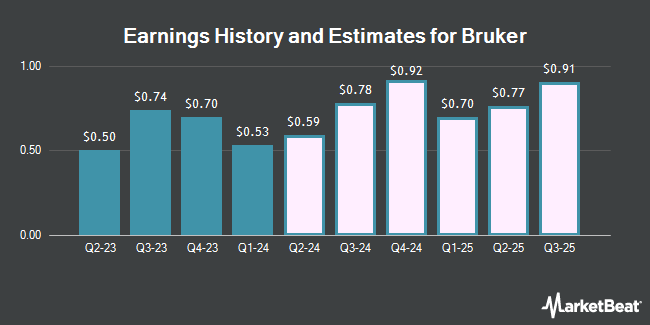
Bruker (NASDAQ:BRKR - Get Free Report) last released its earnings results on Wednesday, May 7th. The medical research company reported $0.47 EPS for the quarter, topping the consensus estimate of $0.46 by $0.01. Bruker had a return on equity of 21.01% and a net margin of 3.36%. The business had revenue of $801.40 million during the quarter, compared to analysts' expectations of $763.83 million. During the same quarter last year, the firm posted $0.53 earnings per share. The firm's revenue was up 11.0% on a year-over-year basis. Equities analysts anticipate that Bruker will post 2.69 earnings per share for the current year.
Bruker Dividend Announcement
The business also recently announced a quarterly dividend, which was paid on Friday, March 28th. Investors of record on Monday, March 17th were given a dividend of $0.05 per share. The ex-dividend date of this dividend was Monday, March 17th. This represents a $0.20 dividend on an annualized basis and a dividend yield of 0.53%. Bruker's payout ratio is presently 26.32%.
Bruker Company Profile
(
Get Free Report)
Bruker Corporation, together with its subsidiaries, develops, manufactures, and distributes scientific instruments, and analytical and diagnostic solutions in the United States, Europe, the Asia Pacific, and internationally. The company operates through four segments: Bruker Scientific Instruments (BSI) BioSpin, BSI CALID, BSI Nano, and Bruker Energy & Supercon Technologies.
See Also
Before you consider Bruker, you'll want to hear this.
MarketBeat keeps track of Wall Street's top-rated and best performing research analysts and the stocks they recommend to their clients on a daily basis. MarketBeat has identified the five stocks that top analysts are quietly whispering to their clients to buy now before the broader market catches on... and Bruker wasn't on the list.
While Bruker currently has a Moderate Buy rating among analysts, top-rated analysts believe these five stocks are better buys.
View The Five Stocks Here
Discover the 10 Best High-Yield Dividend Stocks for 2025 and secure reliable income in uncertain markets. Download the report now to identify top dividend payers and avoid common yield traps.
Get This Free Report
Like this article? Share it with a colleague.
Link copied to clipboard.