Baillie Gifford & Co. cut its stake in Marsh & McLennan Companies, Inc. (NYSE:MMC - Free Report) by 10.3% during the first quarter, according to its most recent 13F filing with the Securities and Exchange Commission. The firm owned 97,682 shares of the financial services provider's stock after selling 11,237 shares during the quarter. Baillie Gifford & Co.'s holdings in Marsh & McLennan Companies were worth $23,837,000 at the end of the most recent quarter.
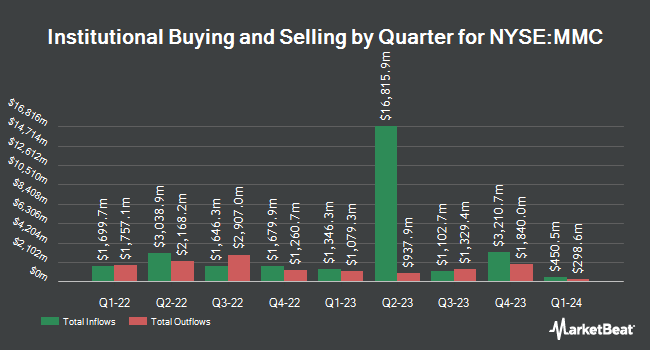
A number of other institutional investors and hedge funds have also made changes to their positions in the stock. Brighton Jones LLC grew its stake in Marsh & McLennan Companies by 51.2% during the 4th quarter. Brighton Jones LLC now owns 8,738 shares of the financial services provider's stock valued at $1,856,000 after purchasing an additional 2,960 shares during the last quarter. Bank Pictet & Cie Europe AG purchased a new position in Marsh & McLennan Companies in the fourth quarter worth approximately $37,178,000. Mitsubishi UFJ Asset Management Co. Ltd. lifted its stake in Marsh & McLennan Companies by 9.3% during the fourth quarter. Mitsubishi UFJ Asset Management Co. Ltd. now owns 797,786 shares of the financial services provider's stock worth $168,501,000 after purchasing an additional 68,069 shares in the last quarter. WINTON GROUP Ltd acquired a new stake in shares of Marsh & McLennan Companies in the fourth quarter valued at $369,000. Finally, UniSuper Management Pty Ltd raised its stake in Marsh & McLennan Companies by 30.2% in the fourth quarter. UniSuper Management Pty Ltd now owns 31,800 shares of the financial services provider's stock valued at $6,755,000 after buying an additional 7,376 shares in the last quarter. 87.99% of the stock is currently owned by hedge funds and other institutional investors.
Marsh & McLennan Companies Stock Down 0.8%
Shares of Marsh & McLennan Companies stock traded down $1.64 on Wednesday, hitting $201.28. The company had a trading volume of 770,200 shares, compared to its average volume of 2,248,570. Marsh & McLennan Companies, Inc. has a twelve month low of $201.14 and a twelve month high of $248.00. The stock has a 50-day moving average of $218.42 and a 200-day moving average of $224.62. The firm has a market capitalization of $98.96 billion, a P/E ratio of 24.13, a P/E/G ratio of 2.50 and a beta of 0.80. The company has a debt-to-equity ratio of 1.19, a current ratio of 1.20 and a quick ratio of 1.20.
Marsh & McLennan Companies (NYSE:MMC - Get Free Report) last issued its quarterly earnings data on Thursday, July 17th. The financial services provider reported $2.72 earnings per share for the quarter, beating the consensus estimate of $2.66 by $0.06. The company had revenue of $6.97 billion for the quarter, compared to analyst estimates of $6.92 billion. Marsh & McLennan Companies had a net margin of 16.00% and a return on equity of 31.90%. The company's revenue was up 12.1% on a year-over-year basis. During the same period in the prior year, the firm earned $2.41 earnings per share. Research analysts predict that Marsh & McLennan Companies, Inc. will post 9.61 earnings per share for the current year.
Marsh & McLennan Companies Increases Dividend
The business also recently declared a quarterly dividend, which will be paid on Friday, August 15th. Stockholders of record on Thursday, July 24th will be paid a $0.90 dividend. This is an increase from Marsh & McLennan Companies's previous quarterly dividend of $0.82. This represents a $3.60 dividend on an annualized basis and a dividend yield of 1.79%. The ex-dividend date is Thursday, July 24th. Marsh & McLennan Companies's dividend payout ratio (DPR) is presently 43.17%.
Analyst Ratings Changes
A number of equities research analysts have weighed in on MMC shares. Jefferies Financial Group lifted their price objective on Marsh & McLennan Companies from $237.00 to $244.00 and gave the company a "hold" rating in a report on Friday, April 11th. Keefe, Bruyette & Woods dropped their price objective on shares of Marsh & McLennan Companies from $214.00 to $210.00 and set an "underperform" rating on the stock in a research note on Monday, July 21st. UBS Group cut their price target on shares of Marsh & McLennan Companies from $261.00 to $258.00 and set a "buy" rating for the company in a report on Monday, July 21st. Barclays reduced their price target on shares of Marsh & McLennan Companies from $249.00 to $233.00 and set an "equal weight" rating for the company in a research report on Monday, July 7th. Finally, Wells Fargo & Company cut their price target on shares of Marsh & McLennan Companies from $229.00 to $226.00 and set an "equal weight" rating on the stock in a report on Friday, July 18th. Two equities research analysts have rated the stock with a sell rating, seven have given a hold rating and five have issued a buy rating to the stock. According to data from MarketBeat, the stock currently has an average rating of "Hold" and an average price target of $239.79.
Get Our Latest Report on MMC
About Marsh & McLennan Companies
(
Free Report)
Marsh & McLennan Cos., Inc is a professional services firm, which engages in offering clients advice and solutions in risk, strategy, and people. It operates through the Risk and Insurance Services, and Consulting segments. The Risk and Insurance Services segment is involved in risk management activities, as well as insurance and reinsurance broking and services.
See Also
Before you consider Marsh & McLennan Companies, you'll want to hear this.
MarketBeat keeps track of Wall Street's top-rated and best performing research analysts and the stocks they recommend to their clients on a daily basis. MarketBeat has identified the five stocks that top analysts are quietly whispering to their clients to buy now before the broader market catches on... and Marsh & McLennan Companies wasn't on the list.
While Marsh & McLennan Companies currently has a Hold rating among analysts, top-rated analysts believe these five stocks are better buys.
View The Five Stocks Here
Discover the 10 Best High-Yield Dividend Stocks for 2025 and secure reliable income in uncertain markets. Download the report now to identify top dividend payers and avoid common yield traps.
Get This Free Report
Like this article? Share it with a colleague.
Link copied to clipboard.