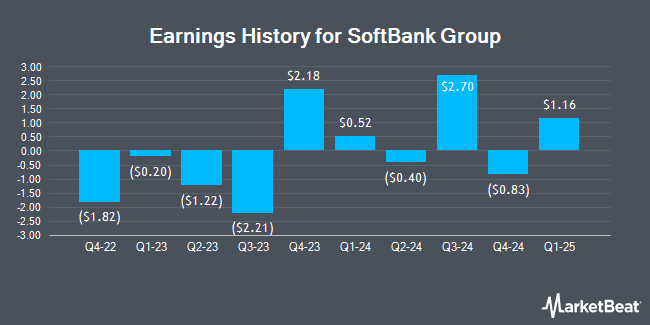
SoftBank Group (OTCMKTS:SFTBY - Get Free Report) issued its quarterly earnings results on Thursday. The technology company reported $1.02 earnings per share (EPS) for the quarter, beating the consensus estimate of $0.28 by $0.74, Zacks reports. SoftBank Group had a return on equity of 12.93% and a net margin of 23.99%. The business had revenue of $12.35 billion for the quarter, compared to analyst estimates of $12.24 billion.
SoftBank Group Trading Down 1.4%
OTCMKTS:SFTBY traded down $0.72 during mid-day trading on Wednesday, hitting $49.87. The company had a trading volume of 307,502 shares, compared to its average volume of 724,036. SoftBank Group has a fifty-two week low of $19.86 and a fifty-two week high of $50.61. The business's fifty day moving average is $35.53 and its two-hundred day moving average is $29.94. The company has a current ratio of 0.75, a quick ratio of 0.73 and a debt-to-equity ratio of 0.89.
About SoftBank Group
(
Get Free Report)
SoftBank Group Corp. provides telecommunication services in Japan and internationally. It operates through Investment Business of Holding Companies, SoftBank Vision Funds, SoftBank, Arm, and Other segments. The company offers mobile communications and solutions to enterprise customers, and broadband services to retail customers; and sells mobile devices and software tools, as well as related services.
Featured Articles
Before you consider SoftBank Group, you'll want to hear this.
MarketBeat keeps track of Wall Street's top-rated and best performing research analysts and the stocks they recommend to their clients on a daily basis. MarketBeat has identified the five stocks that top analysts are quietly whispering to their clients to buy now before the broader market catches on... and SoftBank Group wasn't on the list.
While SoftBank Group currently has a Hold rating among analysts, top-rated analysts believe these five stocks are better buys.
View The Five Stocks Here
Discover the 10 Best High-Yield Dividend Stocks for 2025 and secure reliable income in uncertain markets. Download the report now to identify top dividend payers and avoid common yield traps.
Get This Free Report
Like this article? Share it with a colleague.
Link copied to clipboard.