
The
S&P 500 NYSEARCA: SPY is the most widely recognized benchmark index for the U.S. equity markets. However, it is important to understand the make-up of the component stocks and the concentrated sectors. The most heavily weight components are from blue-chip companies in the technology, healthcare, energy, and financial sectors. The epicenter stocks in the travel, leisure, entertainment, consumer discretionary and consumer staples were hit the hardest during the
pandemic of which most were components of the S&P 500. On the other hand,
Nasdaq 100 index NASDAQ: QQQ contains the majority of the pandemic winners composed of technology,
semiconductors, cloud,
ecommerce, social media, electric vehicles (EVs), renewable and clean energy, Fintechs and software companies. The SPY is considered value and QQQ is considered growth, which explains the divergence between the two indexes as the SPY played catch-up behind the dizzying QQQ gains in 2020. In 2021, the shoe was on the other foot thanks to the accelerations of
COVID-19 vaccinations fueling the reopening narrative.
SPY Beating the QQQ
This was illustrated by the rotation out of growth into value (IE: EV stocks selling off while airline and cruise stocks rise). This rotation has caused the SPY to weather the recent market downdraft better than the QQQ as evidenced by the 2.61% year-to-date (YTD) versus (-1.61%) performance of the SPY vs. QQQ. It’s become commonplace to see the S&P 500 trading positive on the day with double-digit gains while the Nasdaq shows triple-digit losses. While both indexes traditionally move together, the blatant divergence will eventually smooth out. The question is where does the S&P 500 go from here?
Reopening Narrative
The passing of the $1.9 trillion stimulus package is expected to bolster consumer spending as pent-up demand is anticipated to result in an explosion of top-line growth. The easing of social distancing and capacity restrictions and reopening of economies may be priced in. The market has been juicing up retail stocks in anticipation of as shares in retail and hospitality stocks are hitting multi-year highs, the bar has been set high, perhaps too high.
Bearish Catalysts
The biggest most obvious bearish catalyst is rising interest rates. While the Federal Reserve has been abundantly clear on its intent to not raise rates this year, the 10-year treasury yields are indicating otherwise. The conventional risk-off trigger kicks in when treasury yields rise past the 1.50% mark. More importantly, the pace at which that level is triggered is a more compelling factor. Other bearish factors range from geopolitical threats, further tariff wars, inflation, credit crisis, and or another pandemic. All these factors seem like outliers at the present, but after going through a black swan event in 2020, no card is completely off the table.
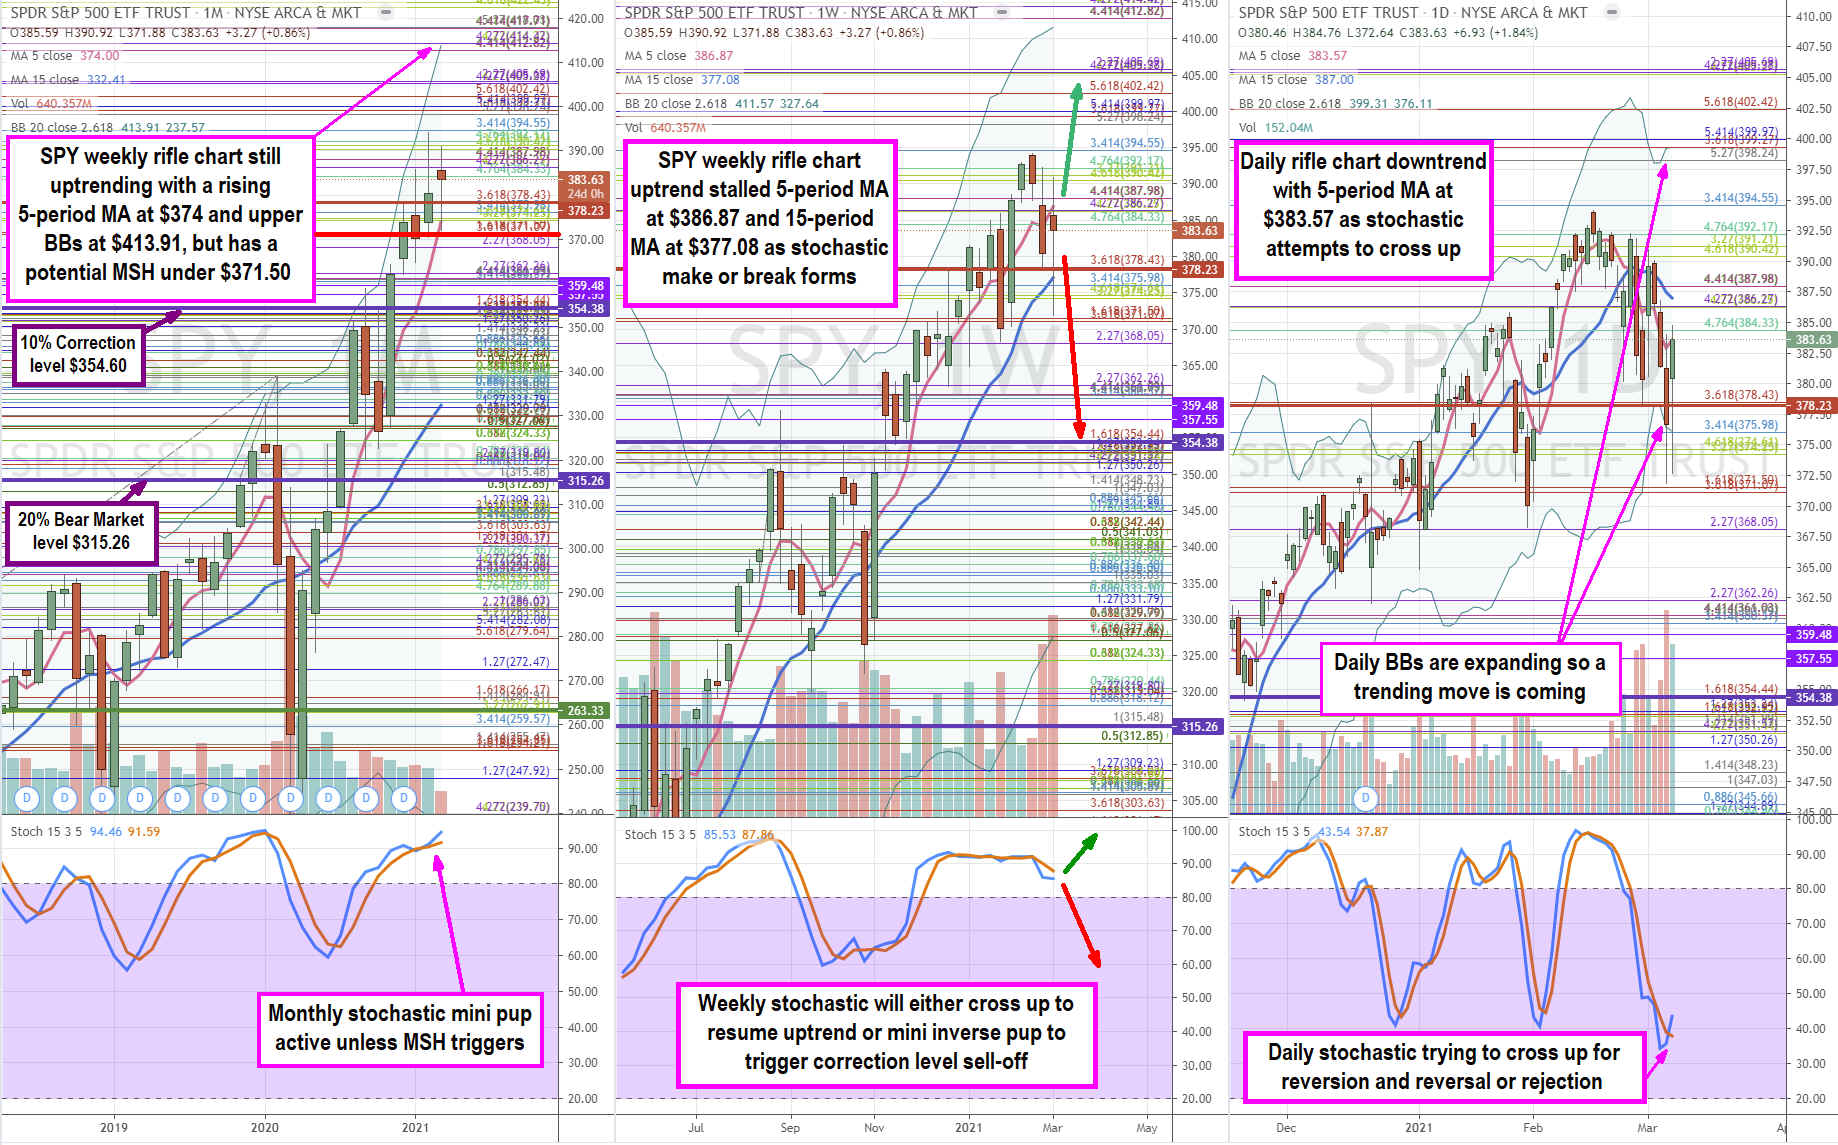
SPY Price Trajectories
Using the rifle charts on monthly, weekly and daily time frames, we lay out the full near-term to longer-term playing field traders and investors on the SPY. Keep in mind that the daily Bollinger Bands (BBs) are expanding again after contracting off the highs, this means a large move is coming. The monthly rifle charts have been uptrending with a rising 5-period moving average (MA) at $374 and upper BBs at $413.91. The monthly 5-period MA was briefly tested as SPY shares hit a low of $371.88 before bouncing back up towards the daily 5-period MA. This monthly low also sets up the potential for a market structure high (MSH) sell trigger under $371.50 in April, assuming the low doesn’t break in March. This is due to the lower candlestick high in March. The weekly rifle chart is in a make or break situation as the uptrend stalls out with the flat 5-period MA at $386.87. The weekly 15-period MA at $377.08 was violently overshot and recovered so far. The weekly stochastic is the wildcard. It has peaked out and stalled above the 80-band. From here it can cross back up to fuel the next leg higher above the weekly 5-period MA as it attempts to take out the prior high towards the daily upper BBs at $399.27 in the bullish case. The bearish case would be a rejection off the weekly 5-period MA that causes the weekly stochastic to trigger a bearish mini inverse pup as it falls under the 80-band and breaking the March lows. This would cause a strong sell-off towards the $354.50s area which would also be the (-10%) correction level from the highs. The daily rifle chart is attempting to bounce with the stochastic cross up. The magnitude of the bounce is important. It first needs to regain the daily 5-period MA at $383.57, then surpass the daily 15-period MA at $387. As the stochastic gains momentum, it can then push higher towards the $394.55 Fibonacci (fib) level and then towards the daily upper BBs at $399.24 with follow through to the $405.69 gatekeeper fib. The prior two daily stochastic bounces have led to new highs on the SPY. However, this was made possible due to the rising weekly stochastic. Things may be different this time around since the weekly stochastic is falling. A near-term bounce to the daily 15-period MA and a rejection back down through the 5-period MA can trigger a deeper sell-off as BBs expand. This direction of the new trend will take several weeks to resolve, but it’s inevitable that a large move is forming.
Before you consider SPDR S&P 500 ETF Trust, you'll want to hear this.
MarketBeat keeps track of Wall Street's top-rated and best performing research analysts and the stocks they recommend to their clients on a daily basis. MarketBeat has identified the five stocks that top analysts are quietly whispering to their clients to buy now before the broader market catches on... and SPDR S&P 500 ETF Trust wasn't on the list.
While SPDR S&P 500 ETF Trust currently has a Hold rating among analysts, top-rated analysts believe these five stocks are better buys.
View The Five Stocks Here
Nuclear energy is entering a new growth cycle as rising power demand, expanding data centers, and renewed policy support bring the sector back into focus. After strong gains in recent years, the most impactful phase of nuclear investment may still be ahead.
This report highlights seven nuclear energy stocks positioned across the value chain—combining near-term revenue with long-term upside as next-generation technologies scale. Click the link below to unlock the full list.
Get This Free Report
Like this article? Share it with a colleague.
Link copied to clipboard.