Steakhouse operator
Ruths Hospitality Group NASDAQ: RUTH stock have illustrated relative strength amid the sell-off in benchmark indexes. The Company experienced over 60% top-line growth in Q4 2021 as it returns to sales growth despite the onset of the
Omicron variant.
Inflationary pressures were evident by the 43% spike in total
beef costs as
food and beverage costs rose to 34.1% compared to 2020. The Company plans to open five to seven new
restaurants annually and continue its growth momentum throughout fiscal 2022 as its expects food costs to have peaked. Prudent investors seeking exposure is an iconic steakhouse brand that continues to grow can watch for opportunistic pullbacks in shares of Ruth’s Hospitality Group.
Q4 Fiscal Year 2021 Earnings Release
On Feb. 24, 2022, Ruths released its fourth-quarter fiscal 2021 results for the quarter ending December 2021. The Company reported a non-GAAP diluted earnings-per-share (EPS) of $0.34, beating analyst estimates by $0.09. Revenues rose 64% year-over-year (YoY) to $126.74 million, beating analyst estimates by $3.28 million. Comparable restaurant sales rose 61.2% YoY for Q4 2021 and 0.5% compared to Q4 2019. Franchise income was $5.5 million versus $3.6 million in prior year quarter. Food and Beverage costs rose 470 basis points to 34.1% compared to Q4 2020. Total beef costs rose 43% YoY. Company-owned comparable restaurant sales grew 4.3% in the quarter to February 22, 2022, compared to 2019. The Company opened three new restaurants in Q4 2021 and expects to open five more Company-owned or managed restaurants by end of 2022. The Company bought back 695,000 shares at an average price of $18.35 per share on Q4 2021. Ruth’s Hospitality ended Feb. 22, 2022, with $84.6 million in cash with $50 million in debt and $4.7 million in credit.
CEO Comments
Ruth’s Hospitality Group CEO Cheryl Henry commented, “The outstanding efforts from our team members allowed us to post solid fourth quarter results with positive comparable sales growth versus 2019 and strong restaurant-level profitability. More importantly, these accomplishments came on the heels of several headwinds, including the emergence of Omicron in December, continued challenges in the labor market, and ongoing beef inflation. All in all, we believe our performance in 2021 has demonstrated that our underlying business is strong.”
Fiscal 2022 Financial Expense Projections
The Company provided its projections for some fiscal 2022 metrics. It expects Q1 2022 food and beverage costs between 32.5% and 33.5%. It expects labor expense improvement of 200 basis points compared to 2019. Combined marketing and general and administrative expenses are expect between 10% to 10.5% with effective income tax rate of 17% to 19%. Fiscal 2022 capital expenditures are expected to be between 53 million to $58 million.
Conference Call Takeaways
CEO Henry mentioned that the Company returned to new unit growth and positive sales growth in 2H 2021 while reinstating its stock buyback program. Comp sales were positive in October, strong in November before softening in December due to the Omicron variant. February 2022 saw sales rebound with comp sales indicating 4.3% growth through eight weeks into the quarter. The Company rolled out capacity management initiatives in late January 2022. She summed it up, “The nature of our high-touch hospitality requires us to be very deliberate in how we introduce technology to our business, as we want to ensure that it not only enhances guest experiences in an authentic way, but also reduces friction in the restaurants and increases our productivity.”
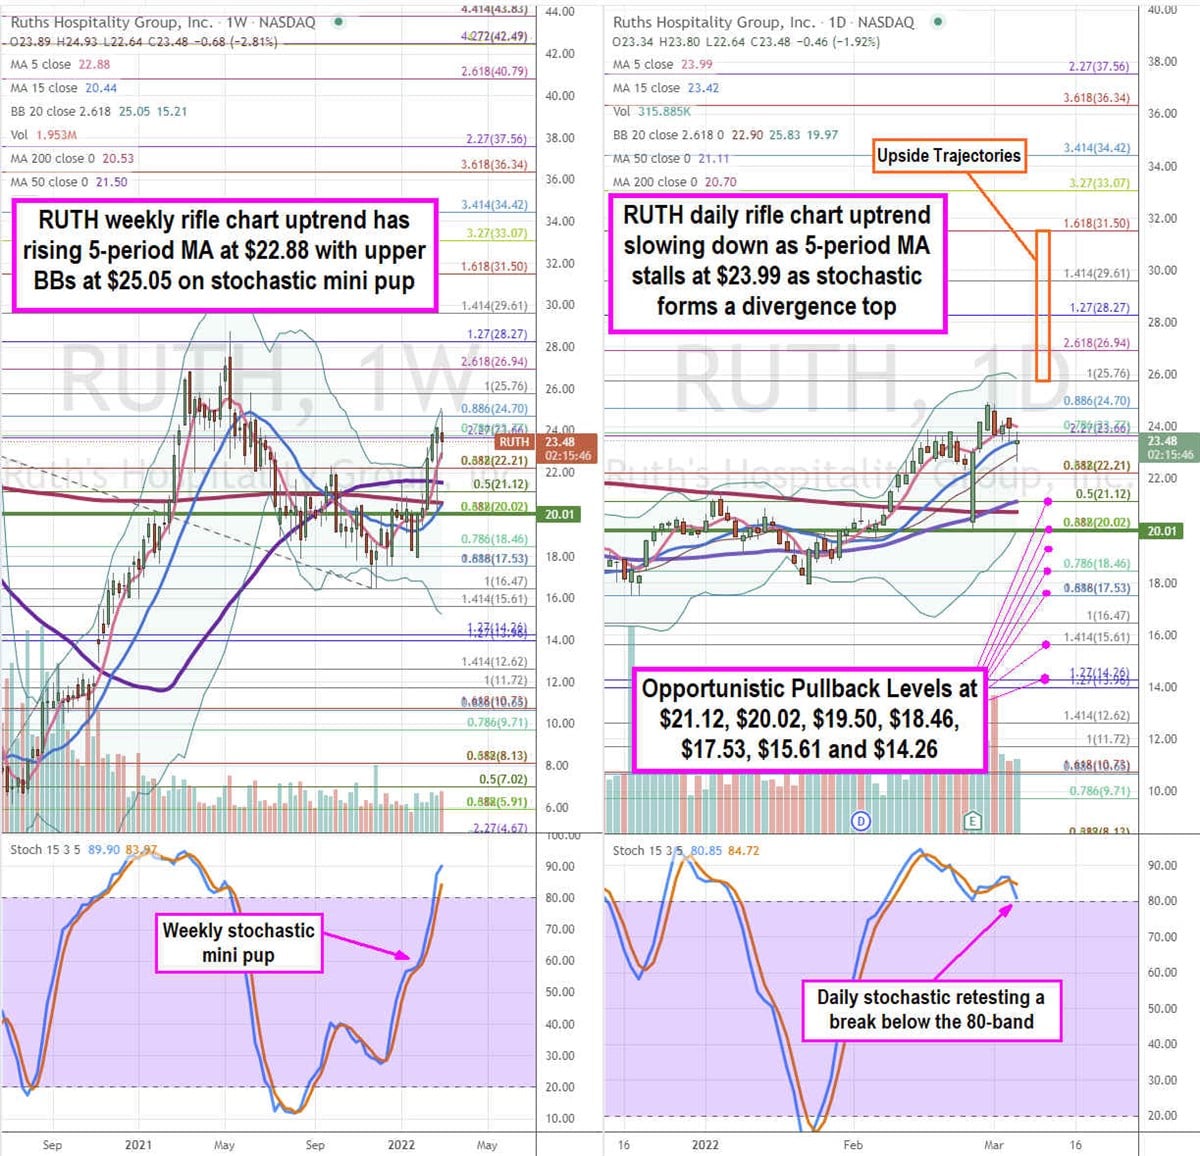
RUTH Price Trajectories
Using the rifle charts on the weekly and daily time frames provides a precision view of the landscape for RUTH stock. The weekly rifle chart uptrend peaked at $28.73 before falling to the $16.47 Fibonacci (fib) level. Shares bounced and formed a weekly mini pup to drive the current uptrend with a rising 5-period moving average (MA) at $22.89 and upper weekly Bollinger Bands (BBs) at $25.07. The weekly 50-period MA sits at $21.51 and 200-period MA at $20.53. The weekly market structure low (MSL) breakout triggered above $20.01. The daily rifle chart formed a pup breakout that is slowing down as the 5-period MA flattens at $23.99 followed by the 15-period MA at $23.42. The daily stochastic has crossed back down again to retest the 80-band. The daily 50-period MA support at $21.11 nearly overlaps the 200-period MA support at $20.70. The daily lower BBs overlap supports at $19.97. Prudent investors can watch for opportunistic pullbacks levels at the $21.21 fib, $20.02 fib, $19.50 fib, $18.46 fib, $17.53 fib, $15.61 fib, and the $14.26 fib level. Upside trajectories range from the $25.76 fib level up towards the $31.50 fib level.
Before you make your next trade, you'll want to hear this.
MarketBeat keeps track of Wall Street's top-rated and best performing research analysts and the stocks they recommend to their clients on a daily basis.
Our team has identified the five stocks that top analysts are quietly whispering to their clients to buy now before the broader market catches on... and none of the big name stocks were on the list.
They believe these five stocks are the five best companies for investors to buy now...
See The Five Stocks Here
MarketBeat just released its list of the 7 hottest IPOs expected to hit Wall Street in 2026. See which companies are preparing to go public and why investors are watching closely.
Get This Free Report
Like this article? Share it with a colleague.
Link copied to clipboard.
