September 2021 brought a rude awakening to investors who got accustomed to the
S&P 500 moving steadily higher.
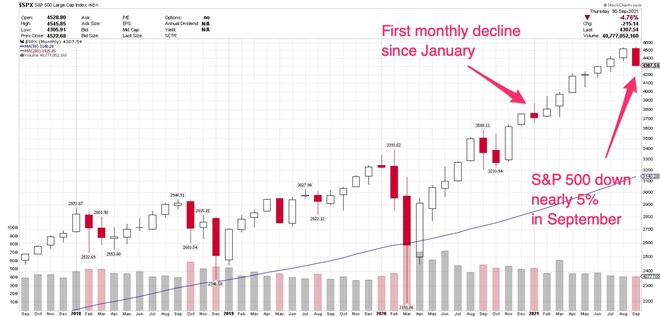
The large-cap domestic index was down nearly 5% for the month, following seven months in a row of gains. To put that in context, the last down month was January. Since then, the S&P 500 gained 17%.
Historically, September has been something of a bust, so what we're seeing is not necessarily unusual.
Should you flee the market in September? Should you be cautious about seasonal returns?
According to a September 7 report issued by Yardeni Research, "Stock Market Indicators: Historical Monthly & Annual Returns," the average percent change in the S&P 500, from 1928 through 2020, is -1%.
That means September is the worst month for S&P 500 returns over that time frame. Only February and May were down, on average, during that time frame. However, both of those months showed much smaller decreases.
On average, the S&P was down .01% in both February and May.
(Side note: For those of you who are market historians, it's true that the S&P 500, as such didn't launch until 1957. However, a predecessor index, called the Composite Index, was started in 1923. Three years later, it began tracking 90 stocks, and grew to the 500 as we know it today, in 1957. For historical purposes, it's fine to use data from the predecessor index.)
Of course, the S&P500 has a long-term bias upward.
Between 1950 and 2020, here's the breakdown of advances and declines, according to data complied by Crestmont Research:
Up days: 53.8%
Down days: 46.2%
Crestmont also sliced and diced that data by decade:
1970s:
Up days: 51.3%
Down days: 48.7%
1980s:
Up Days: 53.0%
Down Days: 47.0%
1990s:
Up Days: 53.7%
Down Days: 46.3%
2000s:
Up Days: 52.3%
Down Days: 47.7%
2010s:
Up Days: 54.9%
Down Days: 45.1%
2020s:
Up Days: 57.3%
Down Days: 42.7%
When I was a financial advisor, I would routinely remind clients that the S&P 500 was consistently and persistently more likely to gain than decline.
That's not easy to remember on days when the market skids 2% or more, as it did on September 28. 2021. It doesn't help that headlines plastered throughout the media are designed to put the fear into investors.
But a reality check is always in order. For example, the old saying, "Sell in May and go away" refers to the historical declines in May, followed by somewhat tepid gains in June. According to Yardeni's research, the average return in June, between 1928 and 2021, was 0.8%. You'd rather have that return than not, but June historically lags the months of January, April, July, November and December.
The last quarter of the year is generally productive for large U.S. stocks, although perhaps you, like me, recall vividly the month of December in 2018, which erased the entire year's gains.
However, it's important not to get tripped up by outliers or single data points. It's a better-investing strategy to focus more on long-term trends.
Historically, the fourth quarter typically trends higher, with average monthly returns as follows:
October: .04%
November: .09%
December: 1.3%
If you're following monthly action in the market, it's worth remembering: Often, big upward price moves begin in the mid- or later parts of the month, not right at the beginning. So a little patience could be in order.
So armed with the knowledge about average monthly performance, should you change your investing strategy?
It depends.
If you have a long-term allocation that you rebalance at regular intervals, or as needed, then some knowledge of market seasonality can help you gauge whether it may be time to fortify your portfolio.
If you invest more tactically, then you may want to drill down further to see which sectors tend to do well during particular months or quarters.
If you are holding individual stocks, be aware that three-fourths of equities tend to follow the broad market's direction. It's not unusual for your stock to correct along with the market, even if it's been a strong performer.
For example, I wrote about Asana NYSE: ASAN recently. This has been a strong performer in 2021, but dropped 10.3% as the broader market sold off. A stock like Asana, with good institutional support, may hold up better than the broader market, and won't necessarily fall into the "sell" category with a market decline. But by being aware of the market's broader trends, you can make better judgments about which stocks to buy, hold or sell at any time of year.
Before you consider Asana, you'll want to hear this.
MarketBeat keeps track of Wall Street's top-rated and best performing research analysts and the stocks they recommend to their clients on a daily basis. MarketBeat has identified the five stocks that top analysts are quietly whispering to their clients to buy now before the broader market catches on... and Asana wasn't on the list.
While Asana currently has a Hold rating among analysts, top-rated analysts believe these five stocks are better buys.
View The Five Stocks Here
Nuclear energy is entering a new growth cycle as rising power demand, expanding data centers, and renewed policy support bring the sector back into focus. After strong gains in recent years, the most impactful phase of nuclear investment may still be ahead.
This report highlights seven nuclear energy stocks positioned across the value chain—combining near-term revenue with long-term upside as next-generation technologies scale. Click the link below to unlock the full list.
Get This Free Report