The Chicago Board of Exchange Global Markets, Inc. (CBOE) reports Q4 2019 earnings pre-market Friday, Feb. 7, 2020 followed by the 8:30 am EST conference call. Analysts are expecting $1.13-earnings per share (EPS) on revenues of $273.70 million. The global trading exchange for U.S. and European equities, options, futures, and forex has been reeling from a continued decrease in trading volumes and take rates as the
commission-free trend continues to expand. Investors will want visibility into future growth, consolidation and the impact of the spread of shrinking take rates. The owner of the New York Stock Exchange,
Intercontinental Exchange (NYSE: ICE) just reported in-line Q4 2019 earnings resulting in a sharp gap down that ironically hasn’t impacted CBOE shares heading into its earnings.
Macro Context
The S&P 500 ETF (NYSEARCA: SPY) is our macro market indicator. Market sentiment has recovered from the Coronavirus panic selling that collapsed the SPY to a low of 320.74 post-market on Jan. 31, 2020. The daily stochastic has crossed up off the 20-band to reach the 333.95 Fibonacci (fib) price level, but left price gaps at 330.01 and 326.18 that will need to be filled/retested eventually. News of President Trump’s acquittal from impeachment charges have fueled SPY to new all-time highs in after-hours session.
Technical Analysis
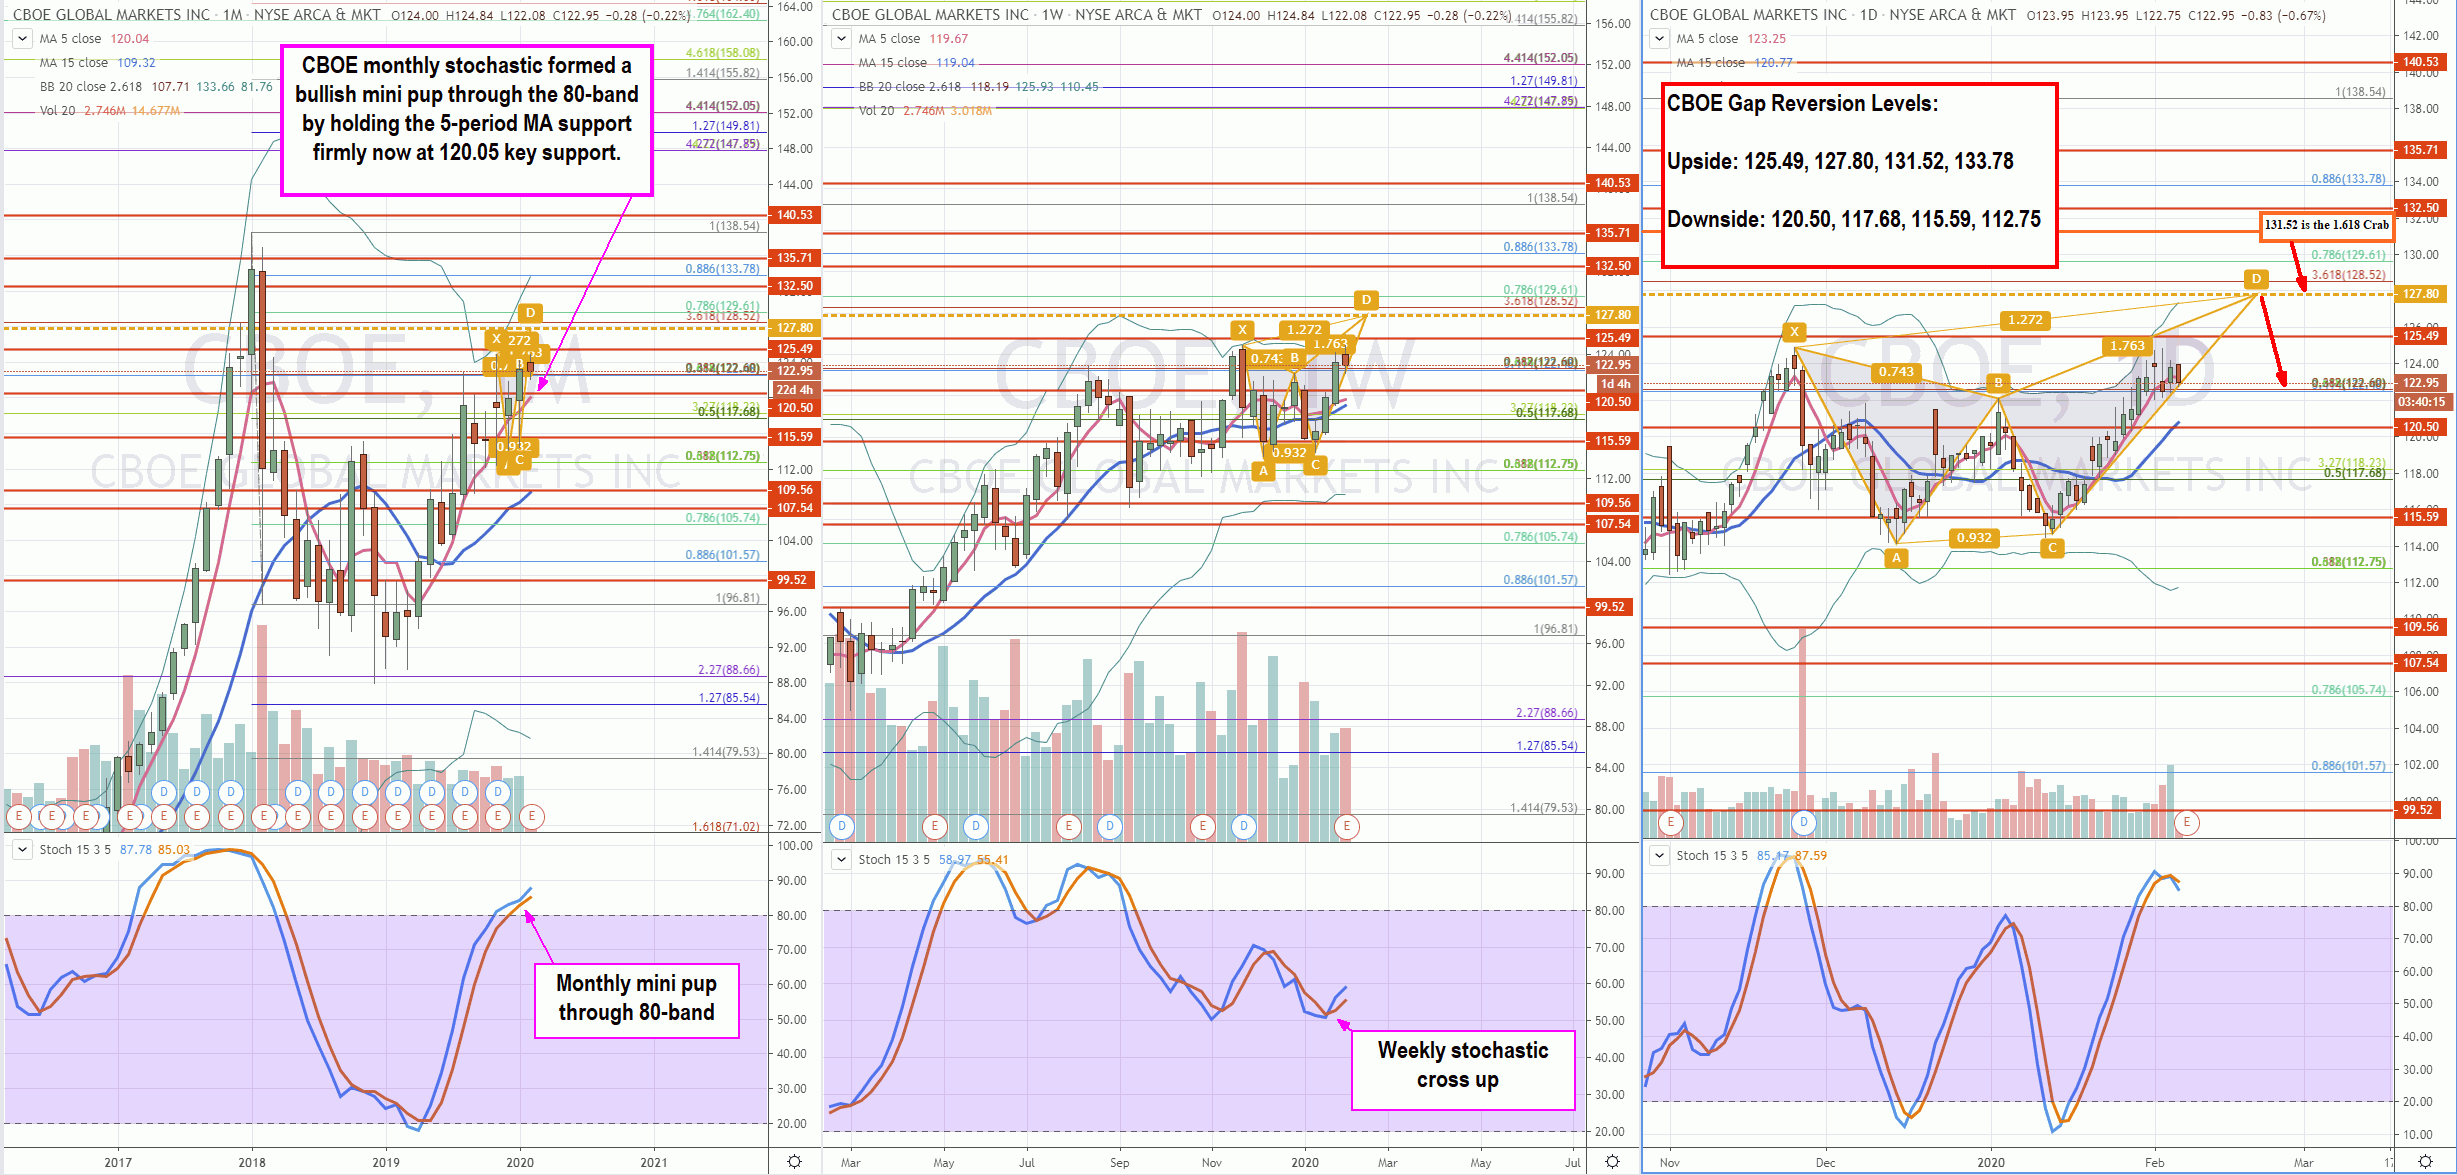
Utilizing the rifle charts, CBOE has been in a bullish monthly mini pup since the breakout through the 101.57 fib from May 2019 deflecting all 5-period moving average (MA) tests higher. The 80-band stochastic pierced with another mini pup after bears attempted to break the 5-period MA in November and December 2019, but the 112.75 super fib held support enabling a springboard coil back up through the 5-period MA towards recent highs at 124.84 on Feb. 4, 2020. The monthly 5-period MA proven support sits at 120.05. The weekly stochastic crossed back up forming a pup breakout with support at 119.67 and upper BBs at 125.93. The daily stochastic peaked with a potential mini inverse pup which would target channel tightening to the 15-period MA at the 120.40 near the monthly 5-period MA. There is also the potential for a harmonic price pattern called a bearish butterfly formation. These patterns project the powerful price reversal at the 1.27 fib of the X to A leg, which is at 127.80. If shares rise to the 1.618 fib, that converts to a bearish crab formation at the 131.52 level for price reversal.
3 market structure low (MSL) trigger and possibly forming a market structure high (MSH) at 61.90. Bulls need to defend the monthly 5-period MA support at 57.52 to maintain the mini pup. This may be a challenge as both the weekly and daily stochastic have crossed back down. When moving averages are flat or rising while stochastic is falling, this is also a make or break set-up. The nominal trading range measured by the daily Bollinger Bands (BBs) is limited to the 57.52 to 61.90. This is due to the contraction phase, which means an expansion is inevitable. The only question is the direction of the expansion. Bollinger bands expand either with a violent price spike that exceeds and then drags the expansion or in a slow grind manner that expands each time price deflects off the 5-period MA.
Sympathy Stocks:
The most direct sympathy stock for CBOE would be its rival the Chicago Mercantile Exchange (NASDAQ: CME) followed by ICE. As noted earlier, ICE shares fell -4.24% on its Q4 2019 earnings reaction, but there was little impact to CBOE down -0.11% or CME down only – 0.71%.
Trading Game Plan:
CBOE earnings will be released pre-market Friday morning followed by the conference call at 8:30 am EST. Since most retail trading platforms commence trading at 8:00 am EST, there’s very little time to play the initial reaction pre-market. Therefore, be prepared for the morning session action on the opening bell with the price reversion envelopes for the second gapper reaction trades. The unique harmonic price pattern(s) of a bearish butterfly or bearish crab sets up precise price reversion levels in addition to the rifle chart bumpers and fibs. Factor in wiggle room of up to 50-cents initially. The upside reversion price levels to consider short-selling on initial tests are: 125.49 sticky 5s/monthly 5-pd MA/weekly upper BBs, 127.80 bearish butterfly point D reversal, 131.52 bearish crab point D reversal, 133.78 monthly upper BBs. These price levels are spread apart to embed a stronger snap back reversion. There are addition fibs that can be played within the gapper envelopes. Be aware that spreads start off very wide but tighten as the day wears on so adjust share sizing accordingly. If the point D harmonic reversal levels at 127.80 or 131.52 peak, then look to target the next gap reversion level down with potential for deeper reversions back to point B.
Before you make your next trade, you'll want to hear this.
MarketBeat keeps track of Wall Street's top-rated and best performing research analysts and the stocks they recommend to their clients on a daily basis.
Our team has identified the five stocks that top analysts are quietly whispering to their clients to buy now before the broader market catches on... and none of the big name stocks were on the list.
They believe these five stocks are the five best companies for investors to buy now...
See The Five Stocks Here
With the proliferation of data centers and electric vehicles, the electric grid will only get more strained. Download this report to learn how energy stocks can play a role in your portfolio as the global demand for energy continues to grow.
Get This Free Report
Like this article? Share it with a colleague.
Link copied to clipboard.