Solar energy systems provider
First Solar, Inc. (NASDAQ: FSLR) has seen a turnaround as demand for photovoltaic (PV) products rebound despite relatively cheap oil prices. First Solar more than doubled shipments of PV modules in 2019 to 5.5 Gigawatts (GW) ranking 8
th on the world’s top PV producers list. Improved efficiencies and process improvements have bolstered operational margins and capacity utilization with megawatt production up 8-percent per day as reported in the Q3 2019 conference call. The company turned a Q3 operating income of $41 million versus operating loss of ($9 million) in Q2 2019 indicating material signs of a turnaround.
Earnings Catalyst
First Solar reports Q4 2019 earnings post-market Feb. 20, 2020, followed by the 4:30 pm EST conference call. Consensus analyst estimates are for 2.04 EPS profit on revenues of $1.713 billion. While China trade war tensions have been alleviated with the Phase One trade deal, Investors are concerned for possible financial impacts from coronavirus disruptions to global supply chains. Guidance adjustments may be interpreted as a one-off if the Company can maintain upbeat FY 2020 forecasts and improvements to the 6.5-GW net bookings for 2021 and 1-GW for 2022. As indicated in the Q3 conference call, the management will also communicate the results of the “very in-depth review” for options regarding the long-term sustainable cost structure for module manufacturing, development and O&M business. This narrative will shape the sentiment moving forward.
Rifle Chart Technical Analysis Trajectories: Longer-Term
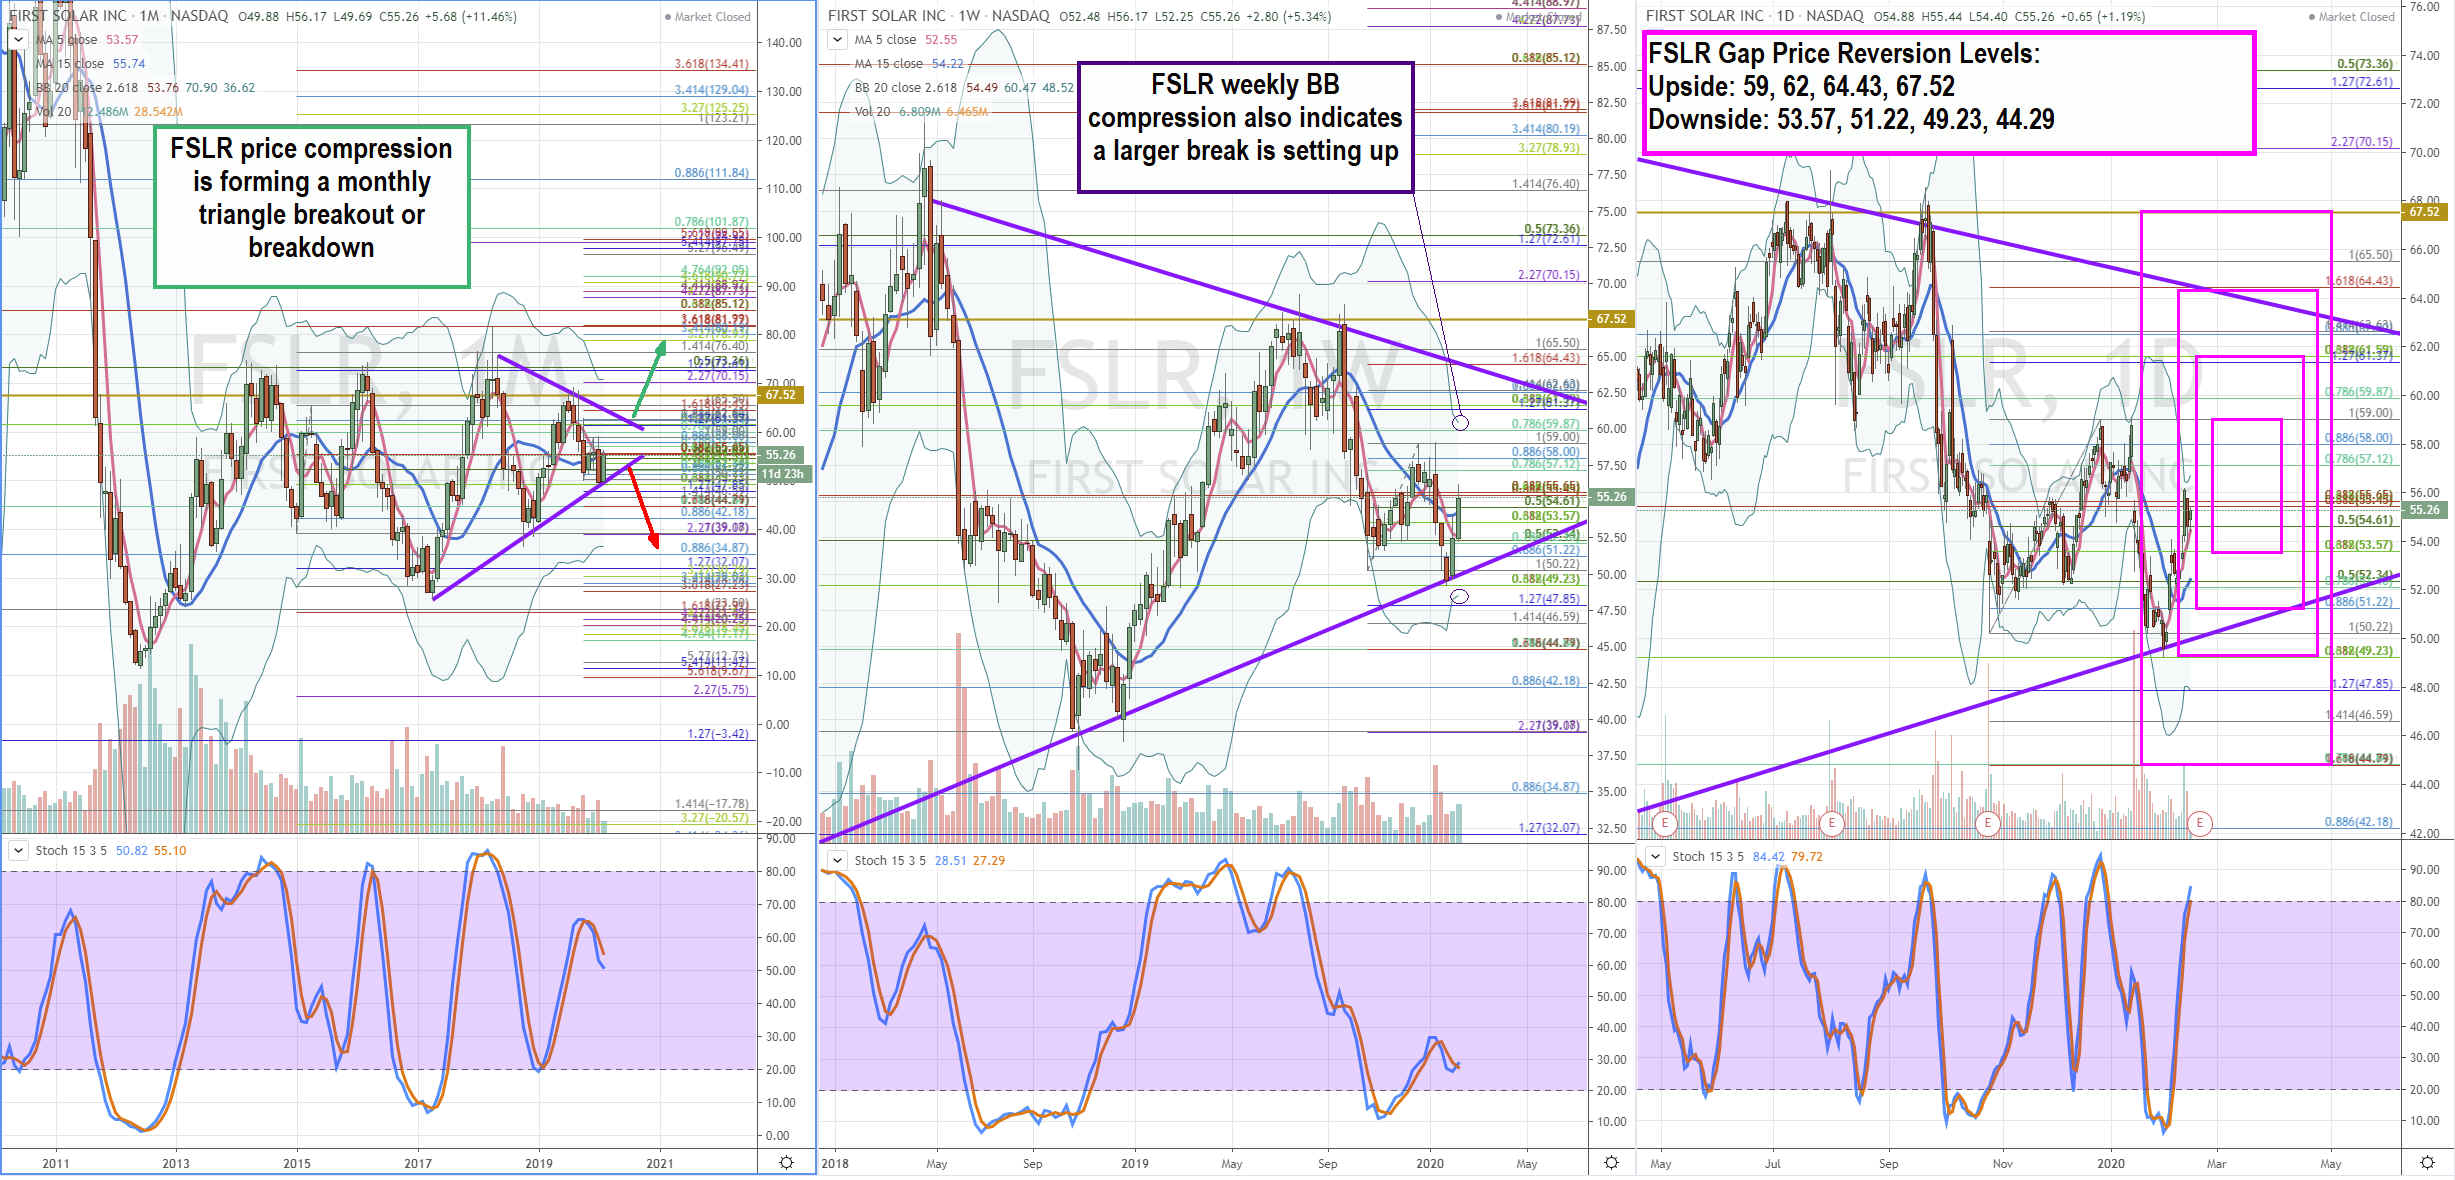
We use the rifle charts on wider time frames to lay out the playing field suitable for swing traders and investors. The monthly chart for FSLR indicates Bollinger Band compression as both upper and lower envelopes point inwards. The same holds true for the weekly BBs as a monthly triangle breakout/breakdown set-up shapes up. This suggests a larger trend will form to break FSLR out of the 62.60 to 47.85 Fibonacci (fib) level. The apex approaches with more time, ultimately triggering the follow through on a breakout above or breakdown below the trendlines. The stochastic and moving averages on both the monthly and weekly rifle charts become less reliable as ranges get tighter ahead of the triangle break. It’s futile attempting to project the eventual direction of the triangle break. Rather, its best to either wait out the break or trade the tightening range until the break forms. Traditionally, symmetrical triangles break in the direction of the prior trend. However, the monthly chart also has the potential for an ascending triangle breakout above the 81.99 super fib. The resolution of the triangle could take months to play out.
Sympathy Stocks:
FSLR is a tier 1 stock in the solar energy group that can be tracked or traded with the Invesco Solar ETF (NYSEARCA: TAN). For more direct positive correlation, traders can play domestic PV panel maker SunPower (NASDAQ: SPWR) followed by Canadian Solar (NASDAQ: CSIQ) , Vivint Solar (NYSE: VSLR) , Sunrun (NASDAQ: RUN) and China-based JinkoSolar (NYSE: JKS) as the world’s top producer of PV modules. Since JKS is a non-domestic solar company, it can be more reactive to China-related news notably coronavirus headlines.
Trading Game Plan for Earnings Gap:
This information is accommodative to intraday and short-term traders looking to play the earnings gap. FSLR isn’t very active or liquid in the post-market sessions upon earnings release. The best liquidity will be found in the following morning session after the earnings release. Spreads can start off wide on thin liquidity but eventually will get tighter. Traders can expect scalps ranging from 0.25 to 0.75 in the first 20-minutes and shrink afterward. The upper and lower triangle trend lines are primary reversion points on the first tests.
Reversion scalps off the key price inflections levels can be played for the second gap reaction then shift focus to the third reaction trend move. The gap price reversion levels for the upside earnings gaps are: 59 double top, 62 super fib, 64.43 super fib/sticky 5s/upper triangle trend line and 67.52 sticky 2.50s. Downside gap reversion price levels are: 53.57 super fib, 51.22 fib, 49.23 super fib/lower triangle trendline and 44.29 super fib/stick 5s. Traders can trade the in-between fibs and sticky 2.50s levels intraday as well. If FSLR gaps over 10-percent, then SPWR and CSIQ are the top two sympathy trades to consider playing utilizing FSLR as the lead indicator.
Before you make your next trade, you'll want to hear this.
MarketBeat keeps track of Wall Street's top-rated and best performing research analysts and the stocks they recommend to their clients on a daily basis.
Our team has identified the five stocks that top analysts are quietly whispering to their clients to buy now before the broader market catches on... and none of the big name stocks were on the list.
They believe these five stocks are the five best companies for investors to buy now...
See The Five Stocks Here
Enter your email address and we’ll send you MarketBeat’s list of ten stocks set to soar in Summer 2026, despite the threat of tariffs and what's happening in Iran. These ten stocks are incredibly resilient and are likely to thrive in any economic environment.
Get This Free Report
Like this article? Share it with a colleague.
Link copied to clipboard.