
Investors and traders are always on the hunt for signals that could ease the process of successfully buying and selling stocks.
Unfortunately, many technical analysts plaster all kinds of complicated indicators all over their charts, which can scare away newer investors.
However, support and resistance levels are easy-to-understand indicators that even the newest of newbies can start using right away.
Learning to identify these levels will simplify your decisions about entering and exiting a stock.
Support is a price level where the stock tends to bottom out when it’s declining
You’ll often find that a stock’s area of support is a price level where demand, or buying power, is strong enough to prevent the price from declining further.
This means the price is more likely to bounce off this level rather than break below it.
However, once the price breaks through this level, it is likely to continue dropping until it finds another support level, at a lower price.
Hitting A Ceiling
Resistance is the opposite.
It’s where the stock price tends to hit a ceiling as it’s trying to move higher. At this level, selling power is strong enough to prevent the price from rising further.
Let’s take a real-life example of a stock.
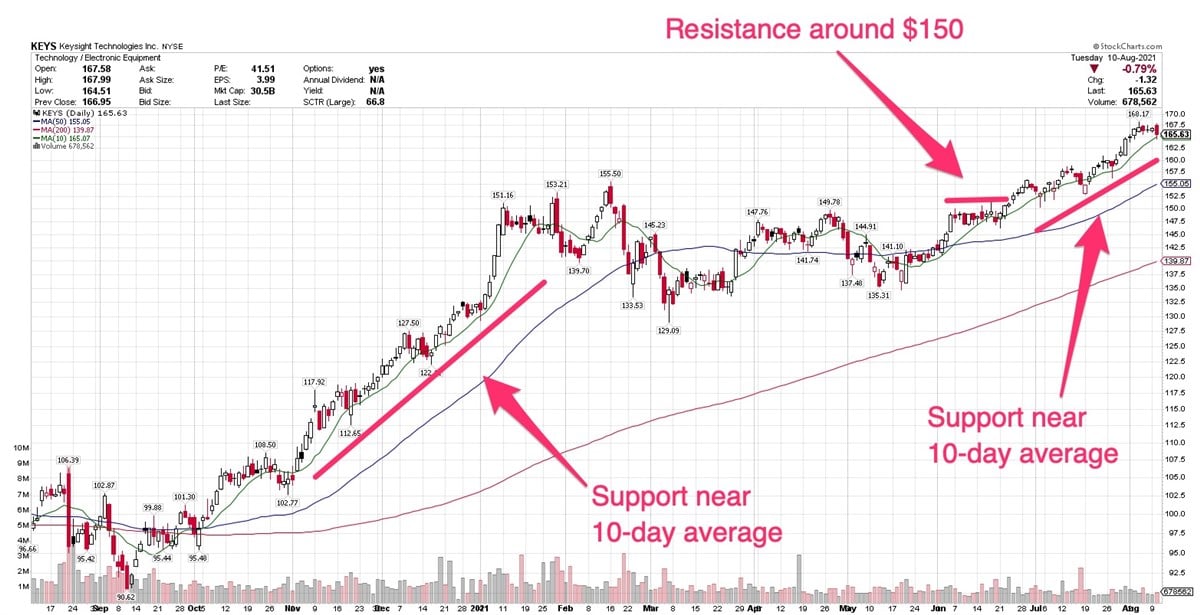
Keysight Technologies NYSE: KEYS began trending along with its 10-day moving average in November 2020. That strong support led into January and preceded a rally to a new high in February 2020. After that, Keysight pulled into a cup-with-handle base, which it cleared in April.
In June, the stock moved into a sideways pattern, hitting resistance around $150. The stock tried to clear that area and even made a strong attempt on June 17 as it got as high as $151.93 before being smacked down again.
After finally mustering up the strength to clear that hurdle, the stock rallied to a new high in mid-July, and once again trended higher, getting good support near its 10-day average.
When Keysight was getting support along the 10-day line, it was clearly a signal to continue holding.
Areas of price resistance are trickier. If you own a stock that’s hitting price resistance, that doesn’t mean you should sell. It does, however, mean you should keep an eye on the stock to determine whether it’s able to rise through resistance, or whether it hits the skids.
Let’s look at the risks of holding when a stock breaks through support.
If a stock crashes through that floor of support on heavy volume, it may be signaling that the stock could correct, and it’s time to sell.
When a stock that slices through its 50-day line, you can see that institutional investors may be less interested in shoring up their positions and more interested in selling - perhaps just selling a partial position, but that’s enough to move the stock.
Again, the key is to watch the volume: If trading is particularly heavy as the stock breaks through the moving average line, that's a definite warning sign.
If the volume is light, it could mean the selling is less serious.
Breaking Support In Heavy Volume
Chewy NYSE: CHWY is a company I personally love, and order from a lot. That’s what happens with a house full of animals.
But you can’t make the mistake of thinking a company you love is always a great stock.
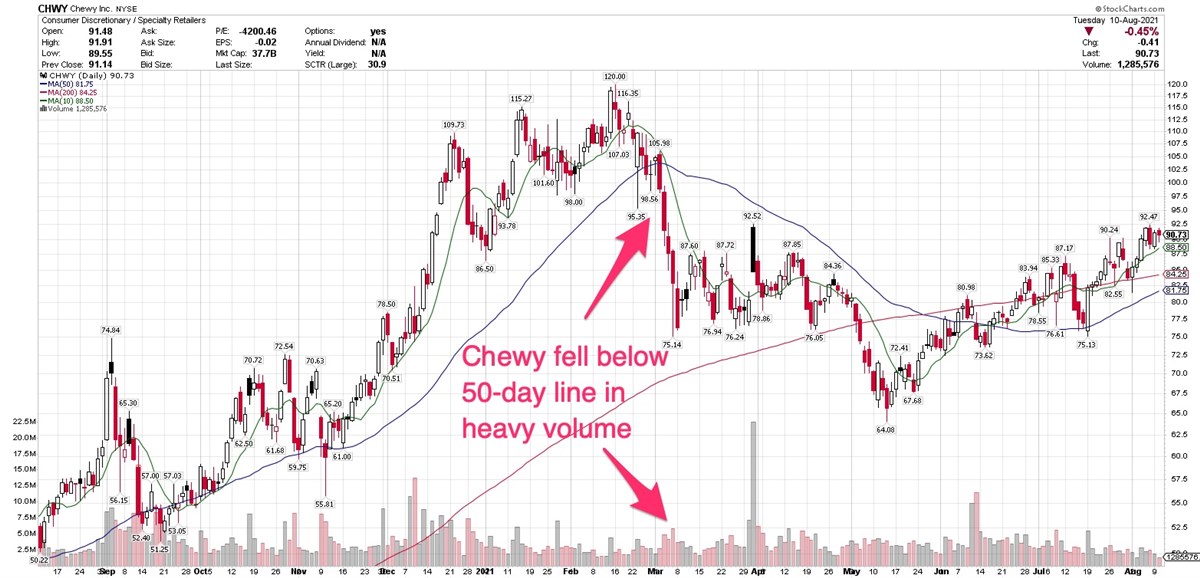
Chewy rallied to a high of $120 in mid-February, then began slipping. It flirted with its 50-day average for several days in late February before dropping decisively below that line on March 3, in volume 51% heavier than normal.
It remained below that line until mid-June and continues to consolidate below that February high.
When a stock declines like that, you might be tempted to ask what happened and try to determine whether the downturn will be short-lived. Unless you are prepared to hold the stock for the long term - as in months or even years - what happened is not important. The chart tells you everything you need to know.
You can make the choice to hold through a consolidation, as long as you are consciously choosing to hold and pay the opportunity cost of not owning another investment.
Even if you choose to sell, the stock is not dead to you! You can always buy it again, at another time, when it begins to show signs of rising through resistance and trending higher.
Before you consider Chewy, you'll want to hear this.
MarketBeat keeps track of Wall Street's top-rated and best performing research analysts and the stocks they recommend to their clients on a daily basis. MarketBeat has identified the five stocks that top analysts are quietly whispering to their clients to buy now before the broader market catches on... and Chewy wasn't on the list.
While Chewy currently has a Moderate Buy rating among analysts, top-rated analysts believe these five stocks are better buys.
View The Five Stocks Here
Nuclear energy is entering a new growth cycle as rising power demand, expanding data centers, and renewed policy support bring the sector back into focus. After strong gains in recent years, the most impactful phase of nuclear investment may still be ahead.
This report highlights seven nuclear energy stocks positioned across the value chain—combining near-term revenue with long-term upside as next-generation technologies scale. Click the link below to unlock the full list.
Get This Free Report