Like most momentum indicators, it can be a valuable tool in volatile markets but is also prone to false signals, and you must use it properly. In this article, you'll learn how to read MACD, how to calculate it and why using MACD for stocks can benefit short-term traders.
What Is the Moving Average Convergence Divergence?
Despite looking like a stock ticker, MACD is an acronym for the moving average convergence divergence, one of the most commonly used momentum indicators in technical analysis. The MACD is an oscillator that uses moving averages to plot lines on your typical stock chart. The lines on the oscillator often converge and diverge (hence the name), creating trading signals based on short-term momentum.
How and Why Traders Use MACD
Since day and swing traders rely on price data rather than fundamentals, using tools like the MACD indicator is essential for predicting future price movements as accurately as possible. For example, a trader may have a stock alert triggered by a specific crossover of the MACD components. MACD can be used for bearish and bullish signals, making it a favorite choice among all traders.
Why do traders like to use the MACD indicator? Here are a few reasons:
- Flexible for Various Strategies: The MACD can trigger bearish and bullish signals over a wide range of timeframes, so day and swing traders find it useful on many tradable assets. Additionally, the MACD has momentum and trend-following indicators qualities, making it useful for different strategies.
- Simple and Beginner-Friendly: The MACD definition is fairly easy to comprehend. It uses clearly labeled parameters, and the signals come from easily identified crossover patterns. Novice day traders often start learning about technical tools through MACD since it combines several useful concepts and doesn’t require a math Ph.D. to interpret.
- Effective Across Markets and Timeframes: The MACD isn’t just for stocks. Since it uses moving averages to send signals, the MACD can also be useful for assets like forex and commodities trading. It’s also customizable — you can use it across daily, weekly or monthly timelines.
But technical analysis isn’t a gateway to foolproof stock picks. Traders using technical tools understand that no system will have a 100% hit rate, and the goal is simply to minimize losses while maximizing gains. That's why you often hear day traders use the same terminology and rules as professional sports bettors: keeping position sizes small, rolling with the winners, and never trading when emotions run high.
How to Calculate MACD
To create two lines and a histogram, the MACD uses a simple formula.
First, you'll need to calculate the MACD line by subtracting the 26-period EMA from the 12-period EMA:
- MACD Line = EMA12 − EMA26
While most traders use daily periods (e.g., 12-day and 26-day EMAs), any timeframe can be applied. The MACD line provides insights into the market trend and its momentum.
Next, calculate the 9-period EMA of the MACD line. This is the signal line, which is plotted against the MACD line. Many trading platforms calculate and display this for you automatically.
The MACD relies on exponential moving averages (EMAs) rather than simple moving averages (SMAs). EMAs place greater emphasis on recent price data, which helps traders identify short-term signals more effectively.
Here's a sample of the MACD on the NVDA Corp. NASDAQ: NVDA stock chart:
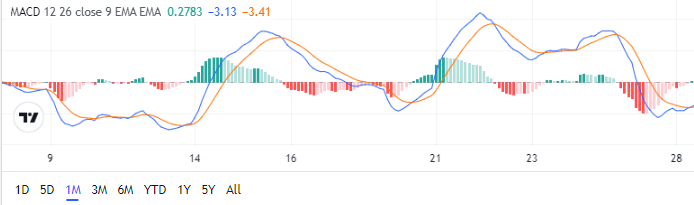
The blue line on this chart represents the MACD calculation, and the orange line represents the signal. Of course, you also might be wondering what the chart's green mountains and red valleys are. The peaks and valleys along the center line represent the divergence between the MACD and signal lines (known as the MACD histogram).
For example, look at the large green area on the NVDA chart. The green signals bullish momentum, but the size of the area shows that the MACD and signal lines have become untethered. Usually, these lines track closely with one another, but when they begin to diverge, the histogram becomes more pronounced.
How to Interpret MACD
The beauty of the MACD lies in its simplicity, but you’ll still need a firm grasp of how it works to interpret it properly. There are several signals to register from MACD, and traders need to understand which ones to look for. If you're bearish on a particular stock, a bullish momentum MACD crossover might not throw up a mark on your radar.
The MACD indicator consists of three components: the MACD line, the signal line and the histogram, with the histogram anchored to the center (sometimes known as the zero line). The MACD line and the signal line can identify trading signals, but the histogram is also an important piece of the puzzle because it can show the strengths or weaknesses of the current trend.
For example, when the MACD line and signal line begin to diverge, the histogram will grow depending on the direction of the trend. If the divergence occurs during bearish price action (i.e., the MACD line continues moving below the signal line), the red valley on the histogram grows larger. The stronger the divergence, the more prominent the histogram will become.
The histogram will shrink toward the zero line as the MACD and signal lines converge again.
Why is this interpretation important? Because, like any indicator, the MACD isn't perfect and can send false signals. Since the calculation is constructed with past stock price data, the MACD is considered a lagging indicator, which means not every signal will result in the expected price action. One of the ways the histogram aids traders is by showing the trend strength along with the actionable signal. For example, if the MACD line begins to drop down toward the signal line during an extremely bullish period, it could indicate that the trend momentum is reversing. However, it could also result in a false signal since the current bullish trend is still feasting on momentum.
Examples of MACD
If you look at the MarketBeat chart for Alphabet Inc. NASDAQ: GOOG, you can flip on the MACD indicator and have it appear in the sub-chart below the stock price. The formula will already be executed, so you don’t need to worry about calculating the 26-day EMA and subtracting the 12-day EMA from it. The chart pictured below shows the MACD line and signal line crisscrossing along the three-month chart and the histogram, which grows larger when the two lines diverge. You can also see how the indicator sends signals by looking at the area around July 24.
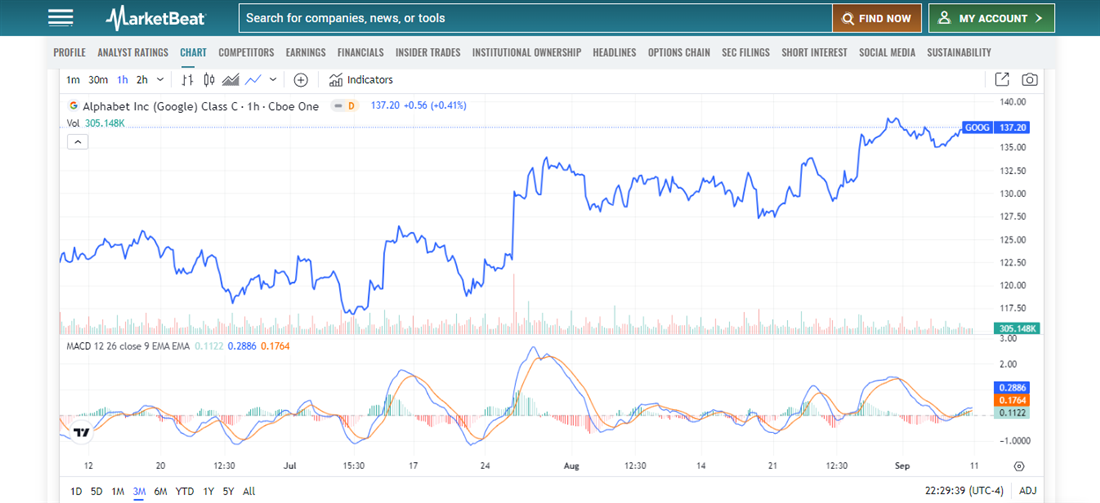
If you were bullish on GOOG shares, the third week of July offered a terrific opportunity. The stock had whipsawed around for the better part of the month, but the volatile trading was about to end, and bullish momentum was ready to return. Around July 24, the MACD line crossed over the signal line and began moving upward, creating a large divergence between the two lines. If the crossover triggered one of your trading signals, you could have purchased GOOG shares for around $120 and rode the momentum to the upper $130s in less than six weeks.
Crossovers and Divergences
Two very important concepts to understand when using MACD are crossovers and convergences. A crossover can occur when the MACD line crosses the signal line and when the MACD line crosses over the zero line. Crossovers far from the zero line tend to be stronger than those closer to the zero line. Divergence can happen when the MACD sends a signal in contrast to the current price movement or when the MACD and signal lines begin to move apart, which could be a signal for a market rapidly gaining momentum.
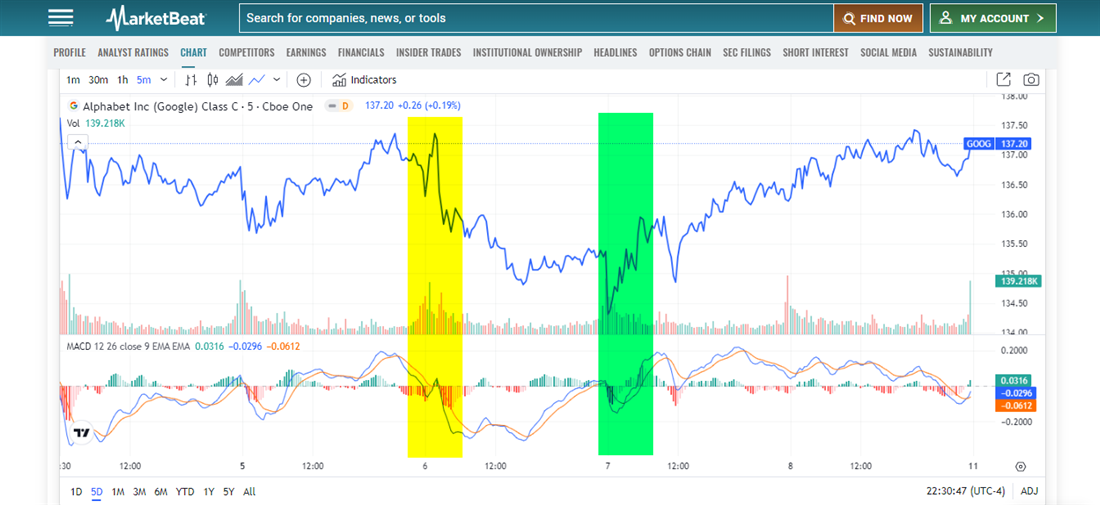
The above five-day GOOG chart comes from one of MarketBeat’s many tools and calculators. In the yellow highlighted area, you’ll notice price action getting volatile while the MACD line began to decline toward the zero line. This could be a bearish signal, with MACD meaning a potential bullish trend reversal. Indeed, the stock price quickly lost bullish momentum at this point, and a trader noticing this crossover could have profited from a short position.
In the green highlighted section, a bullish signal appears while the MACD and signal lines are below the zero line. Here, the MACD line crosses over the signal line while the price begins rebounding, often indicating a break in bearish momentum. After the crossover here, GOOG stock price began an ascent that didn’t peter out until the MACD crossed back over the signal line and began heading downward toward the zero line.
The MACD indicator is one of the most popular technical trading tools because it is easy to understand, simple to calculate and provides clear signals that automated alerts or systems can easily trigger. MACD can be used by day traders or swing traders, making it a more versatile technical analysis feature. You can also find the crossovers in bear and bull markets, and MACD can work across various asset classes like stocks, currencies and commodities.
However, the MACD isn’t without its flaws. Because it's a lagging indicator, not every crossover signal will be actionable. Many false signals will occur, especially when markets are whipsawing around, and trends have difficulty gaining steam. A range-bound market or complacent market isn’t ideal for tools like MACD.
To maximize your trading success, use tools like MACD in good situations and also use it in conjunction with other indicators. One indicator often used side-by-side with MACD is the relative strength index (RSI). RSI is another momentum indicator used to identify overbought and oversold conditions. Since MACD is prone to predicting false breakouts, using another indicator like RSI to confirm the signal can save time, money and mental anguish.
Before you consider Alphabet, you'll want to hear this.
MarketBeat keeps track of Wall Street's top-rated and best performing research analysts and the stocks they recommend to their clients on a daily basis. MarketBeat has identified the five stocks that top analysts are quietly whispering to their clients to buy now before the broader market catches on... and Alphabet wasn't on the list.
While Alphabet currently has a Moderate Buy rating among analysts, top-rated analysts believe these five stocks are better buys.