This is where compound annual growth rate (CAGR) comes into play. What is compound annual growth rate? Let’s take a few minutes to define CAGR, learn the compound growth formula, learn to calculate CAGR and demystify the concept of CAGR.
Calculating CAGR will provide you with valuable financial insight that can make a significant difference in your investment strategy.
What is compound annual growth rate (CAGR)?
To answer the question “What is a compound annual growth rate?” it is first necessary to explore the definition of CAGR. CAGR is a critical financial metric used by investors, analysts and businesses to evaluate investments or assets' performance and growth potential. CAGR quantifies the annualized rate of return over a specific period, offering a more comprehensive and accurate perspective on an investment's growth trajectory.
CAGR is particularly valuable because it considers the effects of compounding. Compounding refers to reinvesting the returns generated in previous periods, leading to exponential growth. By factoring in compounding, CAGR provides a more realistic representation of how an investment would have grown if it had achieved a consistent growth rate each year.
What is CAGR used for?
Now that you know the definition of CAGR, it is essential to understand that it isn't merely a static figure but a dynamic instrument that illuminates the financial landscape. Understanding the CAGR formula and how CAGR is employed can significantly enhance your ability to gauge investment returns, compare performance and anticipate future outcomes. Let’s dissect the diverse roles of the annual compounded growth rate, from evaluating historical performance to making forecasts, providing you with the insights necessary to navigate the complexities of finance effectively.
Investment returns
CAGR is a fundamental tool for calculating and communicating the average returns of investment funds. The calculation for CAGR provides a standardized method to express how an investment has grown over a specific period. For investors, calculating a CAGR means assessing the historical performance of investment options and gaining insights into which investments have delivered consistent returns. This is particularly valuable for those looking to make informed investment decisions.
The CAGR calculation formula demonstrates and compares the performance of investment advisors like Edward Jones, financial institutions or individual investment portfolios. By calculating and comparing CAGR values, investors and clients can evaluate the track record of various advisors or investment options. This allows them to choose advisors or portfolios that deliver steady and favorable returns over time.
Asset returns
The annual growth rate calculator is a versatile tool that provides a metric that extends beyond investment funds. It can be applied to calculate the returns of individual assets, portfolios, or any items that have the potential to increase or decrease in value. This flexibility makes it a valuable tool for assessing the growth of various assets, from stocks and bonds to real estate investments.
Investors often use CAGR to compare the historical returns of asset classes or investment options. For instance, they may analyze how stocks have performed relative to bonds or compare the returns from investing in stocks with those from holding funds in a savings account. By examining historical CAGR values, investors can gain insights into which types of investments have historically provided more favorable returns.
Future predictions
Learning how to calculate CAGR isn't just about analyzing past performance; it can also be a valuable tool for making future predictions. By extrapolating the historical CAGR of an investment or asset, you can estimate its potential future returns or gains. However, it's essential to remember that CAGR assumes a consistent growth rate, which may not always hold in the real world. Therefore, these predictions should be used cautiously and with other forecasting methods.
What CAGR tells you
Now that you grasp the essence and versatility of CAGR, let's dive deeper into what CAGR can reveal. Beyond its fundamental definition and applications, CAGR serves as a treasure trove of insights for investors, offering a nuanced understanding of investment performance, historical trends and potential future outcomes.
Assessing investment quality
One of the primary roles of CAGR is to help investors gauge the quality of their investments. When you evaluate an investment, knowing its CAGR can offer you a clear perspective on how well it has performed. Generally, a higher CAGR is desirable, as it signifies robust growth. However, it's essential to consider the investment landscape and your objectives. You can usually consider a favorable CAGR as one that outperforms industry benchmarks and inflation rates.
Comparative analysis
CAGR also excels in facilitating comparative analysis. It allows you to assess how different investments, advisors, or portfolios have fared over time. By comparing the CAGR of two or more investments, you can discern which one has delivered superior returns. This method enables you to make data-driven choices, pitting investments against one another or benchmarking them against market indices.
Another invaluable application of CAGR is tracking historical performance. Suppose you wish to understand how stocks have stacked against bonds or assess the returns from stashing funds in a savings account. Examining these options' historical CAGR values provides a historical context. It lets you discern trends, make informed investment decisions and optimize your portfolio.
Forecasting future gains
While CAGR primarily deals with historical data, it also holds potential for forecasting future gains. By extrapolating the historical CAGR of an investment or asset, you can estimate its potential future returns.
CAGR is a versatile tool that empowers investors to assess investment quality, make informed comparisons, track historical performance and even make cautious predictions. While it doesn't provide a comprehensive picture of investment risk, its ability to distill complex financial data into a single metric makes it an indispensable resource for investors of all levels. Understanding the compound annual growth rate meaning and what CAGR tells you is a pivotal step in making informed investment decisions and optimizing your financial portfolio.
What is a good CAGR?
What is a good compound annual growth rate? The notion of a "good" CAGR is not one-size-fits-all; it varies depending on the industry and the growth stage. We'll explore what is considered a good CAGR for mature industries, late-stage growth industries and early-stage growth industries.
Early-stage growth industries are the most dynamic and offer substantial growth potential. A good CAGR can be much higher in these sectors, often exceeding 20% and sometimes even surpassing 100%. Investors in early-stage growth industries are willing to accept higher risks for the prospect of substantial rewards. A high CAGR here reflects the industry's potential for exponential growth.
Late-stage growth industries have seen significant expansion but still offer room for further development. In such sectors, a good CAGR typically falls from 10% to 20%. These industries have a proven track record of growth but may not be as dynamic as early-stage sectors. You can often look for consistent CAGRs in this range as a sign of continued progress.
A good CAGR is relatively modest in mature industries, characterized by stable market conditions and limited room for expansion. You can consider a CAGR range of 5% to 10% healthy. These industries have already experienced substantial growth and have established themselves in the market. Hence, achieving high double-digit or triple-digit CAGRs is often unrealistic and unsustainable.
When determining whether a CAGR is good, it's essential to consider the industry's characteristics, your investment goals and your risk tolerance. A CAGR that surpasses industry benchmarks and outpaces inflation rates is favorable. However, it's equally vital to assess whether the growth rate is sustainable over the long term.
How to calculate compound annual growth rate
Let’s take a minute to break down a real-world example of how to calculate CAGR. In this example, we will utilize Planet Fitness NYSE: PLNT.
Planet Fitness is a renowned fitness chain that operates through a franchise model and generates revenue primarily from membership fees, personal training services, merchandise sales and other sources.
Planet Fitness specializes in offering low-cost gym memberships within a "judgment-free zone," targeting casual or first-time gym-goers. The company's growth strategy focuses on cost efficiency, strategic partnerships and diversified revenue streams, contributing to its notable success in recent years. We will calculate the CAGR based on its revenue data from 2013 to 2022 to evaluate its revenue growth over a specific period.
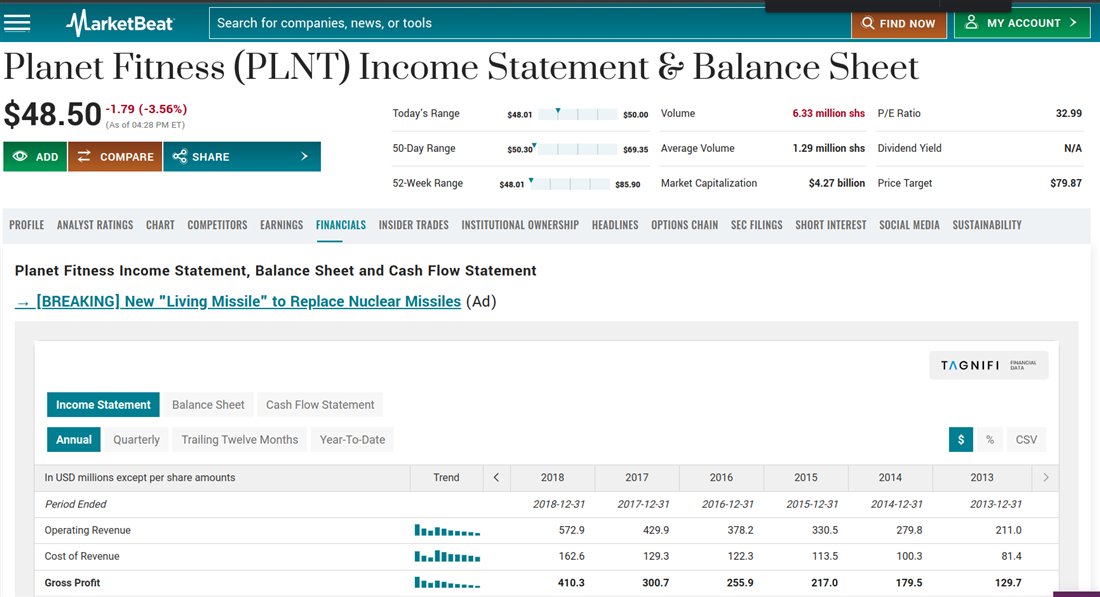
First, you will want to look at Planet Fitness’s financial data. When reviewing the income statement, you will want to look at the company’s operating revenue. Below is the annual revenue data for Planet Fitness, along with the calculated CAGR for each year:
|
Year
|
Revenue (in millions)
|
Year-over-year CAGR
|
|
2013
|
$211
|
N/A
|
|
2014
|
$280
|
32.56%
|
|
2015
|
$331
|
18.21%
|
|
2016
|
$378
|
13.98%
|
|
2017
|
$430
|
13.81%
|
|
2018
|
$573
|
33.26%
|
|
2019
|
$689
|
20.24%
|
|
2020
|
$407
|
-40.99%
|
|
2021
|
$587
|
44.19%
|
|
2022
|
$937
|
59.56%
|
Now, let's proceed to calculate the CAGR based on this data. The CAGR (Compound Annual Growth Rate) formula is as follows:
CAGR = (EV / IV) ^ (1 / n) - 1
Where:
- EV (Ending Value) represents the final revenue for the most recent year.
- IV (Initial Value) represents the revenue for the starting year.
- n is the total number of years in the period.
Step 1: Define the variables.
- EV (ending value) = $937 million (2022)
- IV (initial value) = $211 million (2013)
- n (number of years) = 9 years
CAGR = (937 / 211) ^ (1 / 9) - 1
Step 3: Calculate the compound annual growth rate (CAGR).
First, calculate the value inside the parentheses:
(937 / 211) = 4.4408 (rounded to four decimal places).
Then, calculate the exponent:
(1 / 9) = 0.1111 (rounded to four decimal places).
Raise the result from step 1 to the power of the result from step 2:
CAGR = 4.4408 ^ 0.1111
Finally, subtract 1 from the result:
CAGR ≈ 1.1281 - 1
CAGR ≈ 0.1281 or 12.81% (rounded to two decimal places).
Step 4: Interpret the result.
The calculated CAGR for Planet Fitness's revenue over the 9 years from 2013 to 2022 is approximately 12.81%. This indicates that, on average, Planet Fitness's annual revenue has grown by about 12.81% per year during this period. Calculating CAGR provides valuable insights into a company's revenue growth trends, assisting in investment analysis and decision-making.
It is crucial to recognize that the CAGR calculation assumes a consistent and steady growth rate over a specified period, simplifying revenue growth representation. In the case of Planet Fitness, we can observe how CAGR can smooth over significant disruptions like the sharp decline in revenue experienced in 2020.
Due to the COVID-19 pandemic, Planet Fitness saw a substantial drop in revenue, which decreased by 41% compared to the previous year. This unprecedented event led to temporary closures of fitness centers and declining memberships as people could not visit gyms due to lockdowns and social distancing measures. While the CAGR calculation provides an average growth rate over the entire period, it may not fully capture the impact of such extraordinary events on a company's financial performance.
Therefore, investors and analysts must consider the CAGR and the specific circumstances surrounding a company's financial data to make well-informed decisions.
CAGR compounding, explained
Compounding is a powerful tool for investors and businesses, meaning CAGR could be a game changer when applied to your portfolio. But what exactly is compounding?
Compounding refers to the process where an investment earns returns not only on the initial principal but also on the accumulated past earnings. In simpler terms, it's the snowball effect of your money making new money.
To truly appreciate the power of CAGR compounding, consider this example:
You invest $10,000 in a stock that yields a 10% return in the first year. At the end of year one, your investment grows to $11,000. In the second year, you earn a 10% return again, but this time, it's not just on your initial $10,000; it's on the $11,000 you now have.
So, your return in the second year is $11,000 x 10% = $1,100, totaling $12,100.
|
Year
|
Principal
|
Yield
|
Return
|
|
Year 1
|
$10,000.00
|
10%
|
$1000.00
|
|
Year 2
|
$11,000.00
|
10%
|
$1100.00
|
|
Year 3
|
$12,100.00
|
10%
|
$1210.00
|
|
Year 4
|
$13,100.00
|
10%
|
$1331.00
|
|
Year 5
|
$14431.00
|
10%
|
$1443.10
|
As this process repeats, you'll notice that your returns become larger each year. This is the magic of compounding. Over time, the growth becomes exponential, and you can see how your initial investment can multiply significantly. CAGR captures this phenomenon succinctly, providing a single growth rate that accounts for compounding. CAGR is crucial for investors because it allows them to assess the true growth potential of an investment over time. It provides a realistic picture of how their money can grow if they reinvest their gains, helping them set expectations and make informed decisions.
How to use CAGR to forecast
Now that you understand the compound annual growth meaning, let's dig into how you can utilize this powerful tool to predict future growth. CAGR isn't solely for analyzing past performance; it's also a potent instrument for making informed predictions about future growth. By leveraging the historical CAGR of an investment or asset, you can estimate its potential returns or gains in the years ahead. However, remember that CAGR assumes a consistent growth rate, which may not always align with real-world fluctuations. To forecast future growth using CAGR, follow these steps:
- Collect historical data. Begin by gathering historical data on the investment or asset you intend to forecast. This dataset should encompass the initial investment value and the ending value for each year within the historical period.
- Calculate historical CAGR: Utilize the historical data to compute the CAGR for the preceding years. You can do this by employing the CAGR formula:
CAGR = (EV / IV) ^ (1 / n) - 1
Here's the breakdown:
- EV represents the ending value at the conclusion of your historical period.
- IV signifies the initial value at the commencement of your historical period.
- n corresponds to the number of years within your historical period.
For example, if your investment commenced at $10,000 (IV) and expanded to $20,000 (EV) over five years (n), your CAGR calculation would be:
CAGR = (20,000 / 10,000) ^ (1 / 5) - 1
First, perform the calculations within the parentheses:
CAGR = (2) ^ (1 / 5) - 1
Now, calculate the exponent:
2 ^ (1 / 5) is approximately 1.1487 (rounded to four decimal places)
3. Finally, subtract 1 from the result:
CAGR = 1.1487 - 1
CAGR ≈ 0.1487 or 14.87% (rounded to two decimal places). So, the CAGR in this example is approximately 14.87%.
- Apply CAGR to future projections: Once you have computed the historical CAGR, you can employ it to forecast the potential future value of your investment or asset. To do this, you'll need to decide the number of years into the future you want to project. For instance, if you're going to predict the value of your investment five years from now, you can use the same CAGR you calculated earlier. In this example, the CAGR represents the expected annual growth rate of your investment.
Using the previous calculation:
CAGR = 0.1487 or 14.87% (rounded)
Calculate Future Value: To forecast the future value of your investment, use the following formula:
Future Value = IV * (1 + CAGR) ^ n
Here is the breakdown:
- IV is the initial value of your investment.
- CAGR is the previously calculated CAGR.
- n is the number of years into the future you want to project.
Continuing the example, if your initial investment is $10,000 and you want to predict its value five years from now:
Future Value = 10,000 * (1 + 0.1487) ^ 5
Future Value ≈ $19,254.14
Therefore, your investment is projected to be approximately $19,254.14 in five years if it grows at the same CAGR.
Limitations of CAGR
Now that you have a solid understanding of CAGR and its applications, knowing its limitations is crucial. While CAGR is a valuable tool for assessing investment performance and making projections, it has drawbacks. Let’s explore the limits of CAGR, shedding light on situations where it may not provide a complete picture or where its application might be less suitable.
- Smoothing effect: CAGR is known for providing a smoothed rate of return. However, this characteristic can be a limitation when assessing the true volatility and fluctuations in an investment's performance. In reality, investment returns can be uneven yearly, and CAGR's smoothing effect may mask periods of significant growth or decline.
- Assumption of consistency: CAGR assumes a consistent annual growth rate over the investment period. This assumption may only sometimes hold, especially for investments that experience erratic or unpredictable growth patterns. CAGR doesn't account for fluctuations or market volatility, which can be a significant limitation when assessing the risk associated with an investment.
- Impact of cash flows: CAGR calculations focus solely on an investment's beginning and ending balances, disregarding any cash flows in between. CAGR can provide misleading results for investors who regularly contribute or withdraw funds from their investments. In such cases, it's essential to consider other metrics like the Internal Rate of Return (IRR) that account for cash flows.
- Overlooking interim performance: CAGR provides a single overall growth rate for an entire investment period. This means it doesn't capture the performance nuances within that period. For instance, an investment might experience excellent growth in the early years, followed by stagnation or losses later. CAGR overlooks these interim variations.
- Dependence on historical data: CAGR relies heavily on historical data, making it backward-looking. While historical performance is valuable, it doesn't guarantee future results. Economic, market or industry conditions can change, impacting an investment's future performance. Relying solely on CAGR for forecasting might lead to inaccurate predictions.
- Inflation ignored: CAGR doesn't account for inflation, which can erode the real value of investment returns over time. When evaluating investment options, especially over long periods, it's crucial to consider the impact of inflation on purchasing power.
- Limited context: CAGR provides a numeric value but lacks context. It doesn't reveal why an investment achieved a specific CAGR or the underlying factors driving its growth. This limitation can hinder investors from making well-informed decisions without a deeper analysis of the investment's fundamentals.
- Not suitable for all investments: While CAGR applies to various investments, it may not suit complex investments with irregular cash flows or intricate financial structures. In such cases, alternative metrics like IRR or net present value (NPV) may yield more accurate results.
- Short-term variability: CAGR may not be as reliable for short-term investments due to the potential for higher short-term volatility. Short investment horizons may result in more significant return variations, making CAGR less meaningful.
- Comparing investments: When comparing investments with different risk profiles, CAGR alone may not provide a fair basis for comparison. Consider risk-adjusted metrics like the Sharpe ratio or standard deviation alongside CAGR to assess investment risk comprehensively.
Understanding these limitations will help you use CAGR judiciously in your investment analysis and decision-making process. While it offers valuable insights into returns and growth, it's essential to consider its context and the specific characteristics of your investments to make well-rounded investment choices.
Unlocking investment secrets with CAGR
CAGR is a powerful tool for investors. It serves as a compass guiding you through the intricate maze of investments, allowing you to assess past performance and anticipate future outcomes. However, while CAGR offers valuable insights, it has limitations, such as its assumption of consistent growth and inability to account for factors like inflation or market volatility. Therefore, using CAGR judiciously is crucial, supplementing your analysis with other metrics when necessary.
Before you make your next trade, you'll want to hear this.
MarketBeat keeps track of Wall Street's top-rated and best performing research analysts and the stocks they recommend to their clients on a daily basis.
They believe these five stocks are the five best companies for investors to buy now...