When doing technical analysis on a stock or reading a stock chart, traders may commonly use a candlestick chart, draw trend lines, and add a moving average to determine price support and resistance levels.
These price chart indicators help you find action patterns. However, many traders believe it's essential to know how a price level is reached or overreached in addition to the price. A momentum indicator can add more context to the stock's price action. The relative strength index (RSI) is a widely used momentum indicator that helps to gauge the momentum driving a stock price to overbought and oversold levels. In this article, you will learn what the RSI is, its purposes and how to use it to help you make more informed decisions regarding trading signals or investing in stocks.
What Is the Relative Strength Index?
The Relative Strength Index (RSI) is a widely used momentum indicator that helps traders gauge the speed and direction of price movements. Represented as a line oscillating between 0 and 100, RSI provides insights into whether a stock is overbought (above 70) or oversold (below 30). Introduced by J. Welles Wilder Jr. in 1978, this tool remains a staple in technical analysis.
Why RSI Matters in Trading
Identifying essential support and resistance levels is crucial for any technical trader. Whether a bull market or bear market, technical trading signals like the Relative Strength Index can provide information to improve accuracy. Having an exact price point lined up for an entry or exit decision leads to better decision-making and fewer bad trades. Using a rules-based system takes the emotion of the trading process, and let's face it, emotional reactions and money simply don't mix well.
In particular, the RSI is one of the more useful technical indicators because of its simplicity and ease of interpretation. The calculation is easy to perform and malleable to different time periods, and the trading signals sent by the indicator are clear and precise.
How to Calculate RSI
RSI calculates average green price closes relative to average red price closes and is reflected as a percentage.
RSI = 100-100/(1+RS)
Where RS represents the average gain divided by the average loss. Charting software automates this calculation, but traders can customize the timeframe to suit their strategy.
How to Interpret RSI
The most common use for the RSI technical indicator is to interpret certain conditions for a stock's price. The RSI calculation helps to provide context to a stock's price.
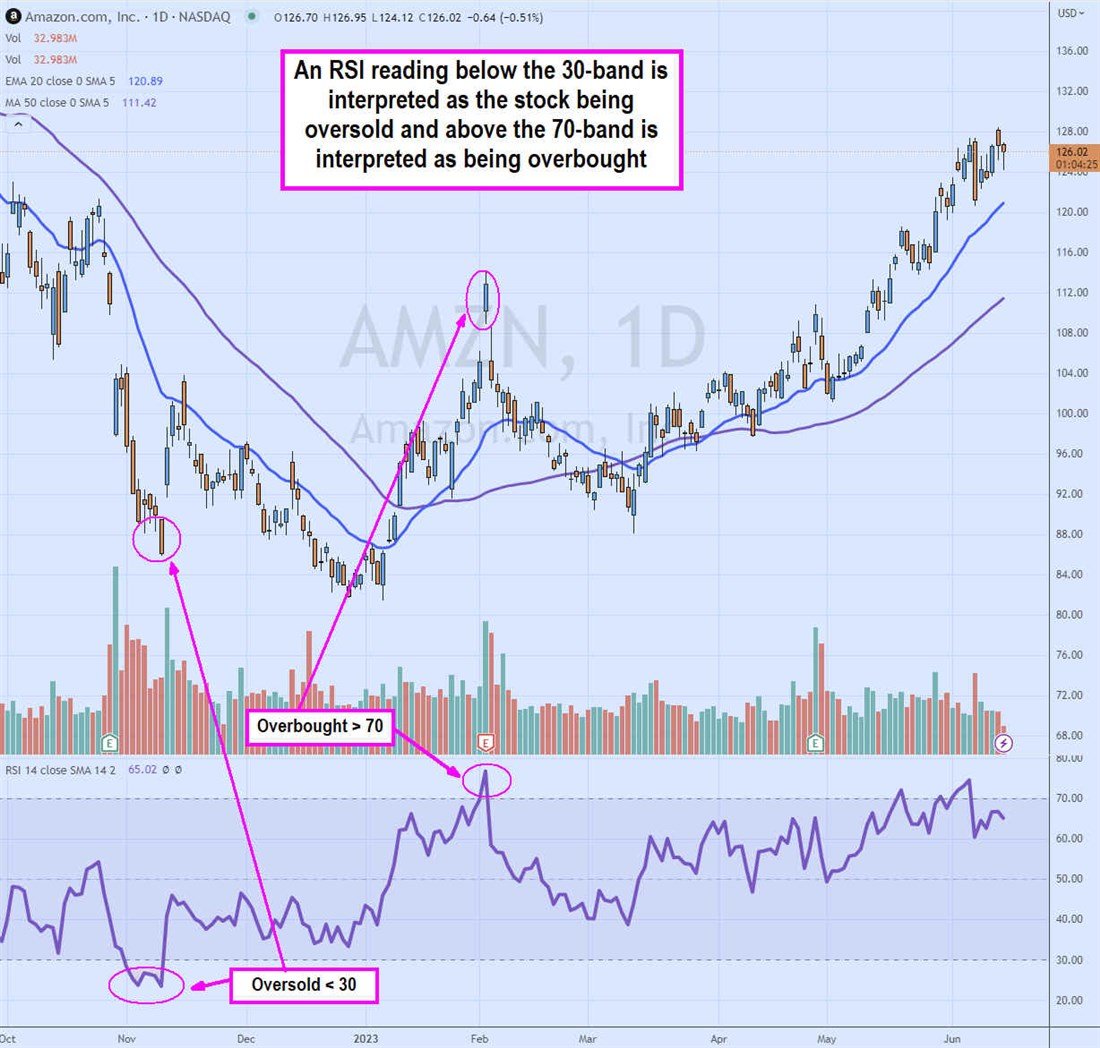
Overbought Conditions
When the RSI oscillator rises through the 70-band, it's considered overbought. It's like an engine that is redlining. Remember that it's not interpreting the stock price as overbought because it's expensive. Still, instead, the velocity or momentum of the move up puts it in an overbought condition, making it prone to see selling.
Oversold Conditions
The stock is considered oversold when the RSI oscillation falls below the 30-band. This doesn't mean the stock price is low. Excessive selling has caused the stock to be in an oversold condition.
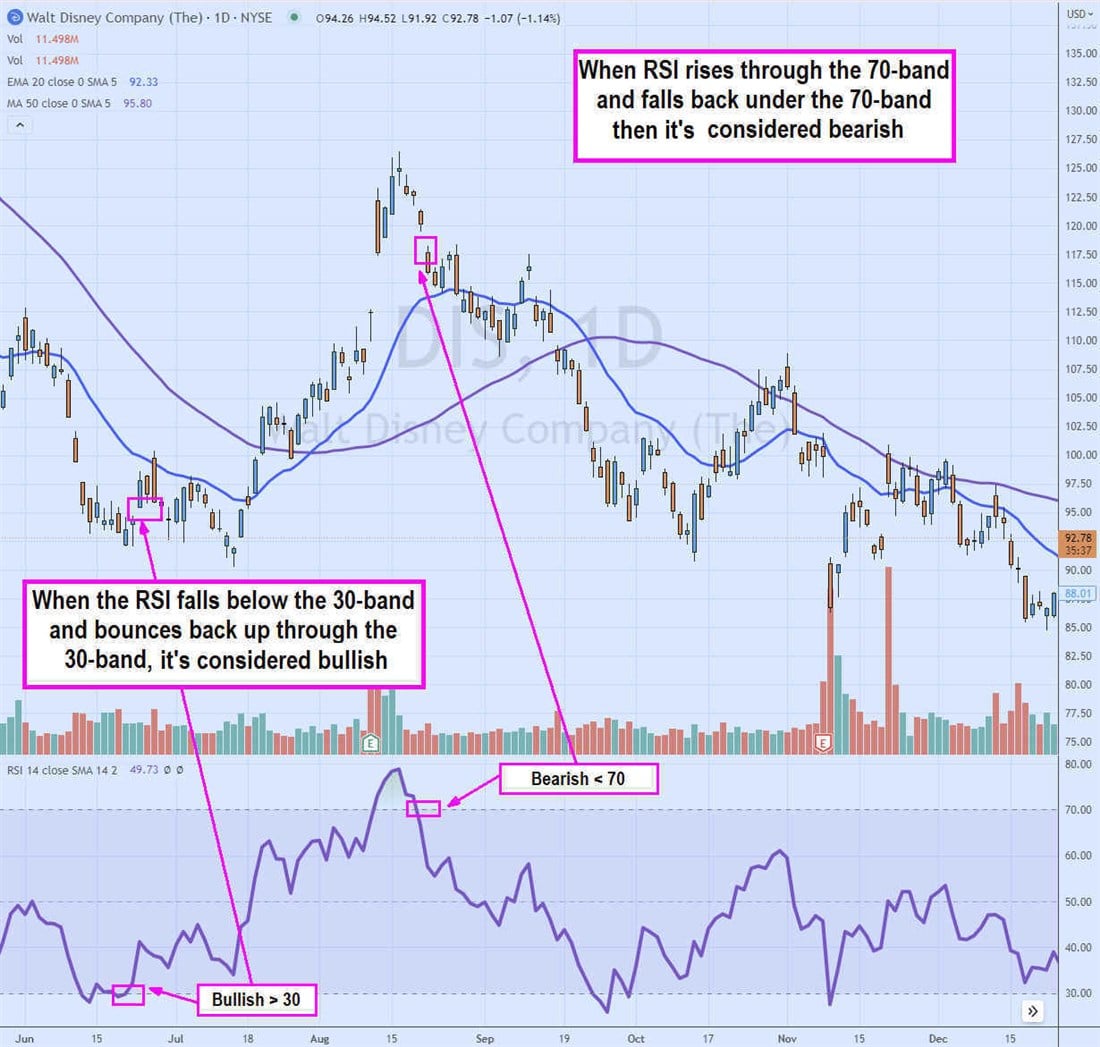
Bullish Indicators
When the RSI reverses back up through the 30-band, it forms a bullish indication that traders may use as a buy trigger. Since the RSI was previously oversold under the 30-band, rising back up through the 30-band winds it up for a fresh bounce. Remember, a bounce through the 30-band doesn't mean the price is cheap. It means the momentum is turning bullish again.
Bearish Indicators
When the RSI falls below the 70-band, it is a bearish indication. Traders will often use this as a sell or a short sell signal. It indicates that the upside momentum has peaked and is exhausted as it reverses back down.
Common Mistakes to Avoid When Using RSI
Here are some frequent pitfalls to be mindful of when using the RSI:
- Overreliance: Use technical analysis in conjunction to provide the best results. Using RSI alone can lead to false trading signals, so always pair it with another momentum indicator.
- Rigidity: Just because a stock shows an overbought signal on the RSI chart doesn't mean a downtrend is looming. Stocks can stay well above 70 or below 30 on RSI and continue trending, frustrating investors. When trends are strong, overbought and oversold conditions aren't as cut and dry as "sell when RSI is over 70."
- Applying to All Markets: The RSI oscillator is most reliable when a trend is firmly in place. While reversal signs can be produced, so many false signals come from reversal patterns that investors are often better served to use technical analysis when the market trend is clear.
Advanced RSI Strategies
Most readers of this article will use RSI for stock evaluation, not just for equity charts. Forex and commodities traders can also use RSI to inform their investment decisions. Momentum trading has produced results across many different asset classes, so RSI is often used on securities nowhere near the NYSE.
But no technical trader has a single hammer in their toolbox. RSI should spot oversold or overbought conditions, but one oscillator is insufficient for due diligence. For example, MACD and RSI are often used together to evaluate a stock's momentum.
Why? Because MACD uses moving averages to produce signals while RSI uses highs and lows to measure momentum velocity. Combining these two indicators gives you more information about the price trend than using RSI or MACD alone, and more information means better decision-making.
Using RSI in Different Market Conditions
Volatility can create havoc on all trading signals, whether fundamental or technical. It didn't matter how good the chart looked or how well a company beat earnings in March 2020; COVID dragged everything down regardless. Technical indicators like RSI lose usefulness when markets are volatile, but that's the case with most trading strategies.
Trending or ranging markets are where momentum indicators can be best used. For example, a stock in an uptrend suddenly shows a bearish divergence on the RSI chart. Is this a sign of impending doom for the stock? No, but it could mean the current uptrend is losing steam and a reversal is possible in the short term. But the key word there is short-term: use technical indicators like RSI over shorter timeframes (which is why Wilder recommended 14 days). You won't find reversals of long-term trends hidden in oversold or overbought signals.
Why Use RSI?
You can use the RSI chart for many reasons:
- Overbought/Oversold Analysis: Avoid buying at peaks or selling at lows by monitoring RSI levels.
- Spotting Reversals: Look for RSI crossing back through 30 or 70 to identify potential trend changes.
- Trade Entries and Exits: Use RSI signals to time positions more effectively. For example, buy when RSI rises above 30 and consider selling as it nears 70.
- Identifying Divergences: Use divergences to anticipate reversals before price movement confirms them.
RSI: Useful Tool, but Consider Limitations
The RSI is a powerful tool for momentum analysis, providing traders with actionable insights into overbought and oversold conditions. The caliber of a solid technical indicator is the ability to be linear across any time frame. This means the RSI works on a five-minute candlestick and daily chart. However, they will have different readings since the periods are different. This means a stock with a 70-band RSI reading on the daily chart can be oversold with a 30-band reading on a five-minute chart intraday. While no indicator is infallible, combining RSI with other methods enhances its effectiveness, helping traders navigate complex markets with confidence.
FAQs
Here are some answers to frequently asked questions regarding the RSI.
What does RSI tell you?
The RSI is a momentum oscillator that tells when a stock is overbought or oversold. It gauges the momentum driving the stock price and whether it's reaching extreme levels. It can also alert you to reversal signals that can help you pinpoint entries and exits on your trades. RSI can be used in multiple time frames, making it useful for traders and investors.
What is the RSI 30 and 70?
RSI is measured on a chart between zero and 100 on the Y-axis and time on the X-axis. The RSI meaning of a drop to 30 or below indicates the stock is in an oversold condition. The stock RSI, meaning on a rise to 70 or higher, indicates an overbought condition. Be aware that just below a stock is under the 30-band doesn't mean it can't go lower.
Many traders make the mistake of buying a stock when it falls to the 30-band as it continues to fall lower. An oversold stock can continue to be oversold as shares drop. The wiser entry would be when the stock returns through the 30-band when the reversal has formed. The same applies to traders who short-sell a stock just as it hits the 70-band and continues to make higher highs. Remember, just because a stock rises through the 70-band doesn't mean share prices can't increase.
What is a good RSI to buy stock?
It's essential not to rely solely on the RSI to determine where to buy a stock. It should be used with other indicators to form a solid buy or sell thesis. The good RSI buy signals form when the RSI oscillator rises back up through the 30-band. However, it is crucial to be aware of the trend of the stock as well as the context for the sell-off. The selling is often not related to the individual stock but because the whole market itself is selling off.
For example, the S&P 500 index selling off on a high consumer price index (CPI) number will likely impact the RSI on your stocks to fall as well. Be sure to check the benchmark indexes just to be sure. Be aware that buying a stock with an RSI of 70 or higher has the risk of chasing a price that may exhaust and reverse as soon as you get in.
Before you consider Amazon.com, you'll want to hear this.
MarketBeat keeps track of Wall Street's top-rated and best performing research analysts and the stocks they recommend to their clients on a daily basis. MarketBeat has identified the five stocks that top analysts are quietly whispering to their clients to buy now before the broader market catches on... and Amazon.com wasn't on the list.
While Amazon.com currently has a Buy rating among analysts, top-rated analysts believe these five stocks are better buys.
View The Five Stocks Here
Explore Elon Musk’s boldest ventures yet—from AI and autonomy to space colonization—and find out how investors can ride the next wave of innovation.
Get This Free Report
Like this article? Share it with a colleague.
Link copied to clipboard.