Technical analysis focuses solely on the stock price action, which is the most relevant for investors or traders that own shares. In this article, we'll show you how to learn technical analysis in five steps so that you can make more informed decisions when it comes to managing your stocks.
What is Technical Analysis?
Technical analysis is observing and examining a stock's price and volume action using various indicators and charts to forecast the direction and magnitude of future price moves. Some called it trading chart analysis. Traders, investors and analysts have used technical analysis for over a century. You can use it on penny stocks to blue-chip stocks. It doesn't discriminate. Technology has helped to automate the calculations making it easier for beginners to learn and follow.
It's a methodology that tries to interpret a stock's price history and identify trends and critical price levels to hypothesize where it may progress. A stock's price dynamically reflects supply and demand for its shares. Technical analysts believe a stock's price history reveals its future trajectory. The proof can be derived from historically repeated patterns to foreshadow how it will materialize. Remember, technical analysis is not 100% correct and shouldn't be the sole methodology for making trades. It should be treated as a complementary tool to help you make more informed trade decisions.
Why Do Traders Use Technical Analysis?
Traders use technical analysis because it focuses on a stock's price action. Since their only concern is to profit from price volatility and trends, technical analysis holds the key to anticipating and reacting to price action. Traders use technical analysis for many reasons:
- Setting price targets: Technical analysis helps forecast price action. Knowing the probability and extent of potential price moves can help place price targets for your trades.
- Identifying critical support and resistance levels: Technical analysis enables you to identify a stock's price trend, support and resistance levels. Knowing those three data points enables you to plan your trades accordingly.
- Timing trade entries and exits: Using momentum indicators can let you know when a stock is overbought or oversold. These momentum indicators can also help to pinpoint reversal points to help time your entries or exits on stock trades.
- Risk and trade management: By being able to quantify price targets and stop-loss prices, it enables you to assess your upside and downside and adjust to manage your risk. For example, you may have criteria for only taking trades that reap a two-to-one reward-to-risk ratio. You might assess XYZ with a potential upside move of $1 based on its resistance level and a downside risk loss of 50 cents based on its multiple price support level. This setup meets your two-to-one upside versus downside criteria, and you can plan your trade accordingly.
An Overview of Technical Indicators
Technical indicators are additional online technical analysis tools plotted on a stock chart to better assist with analysis. They are mathematical calculations that crunch price, time and volume data to generate signals and readings about the underlying stock. Indicators generally fall into two categories: price and momentum. Price indicators provide information about the price, like support and resistance levels.
Momentum indicators pertain to the velocity of the price movement of the stock movement shaping the conditions like overbought and oversold. Momentum indicators are not indicative of the price. This means a stock may be oversold at $37.35 on the 30-band RSI today, but it may be considered oversold at a higher price of $37.65 as it falls to the 30-band RSI tomorrow. Here is a list of commonly used technical indicators, also called chart indicators, that are widely used and included in most charting platforms.
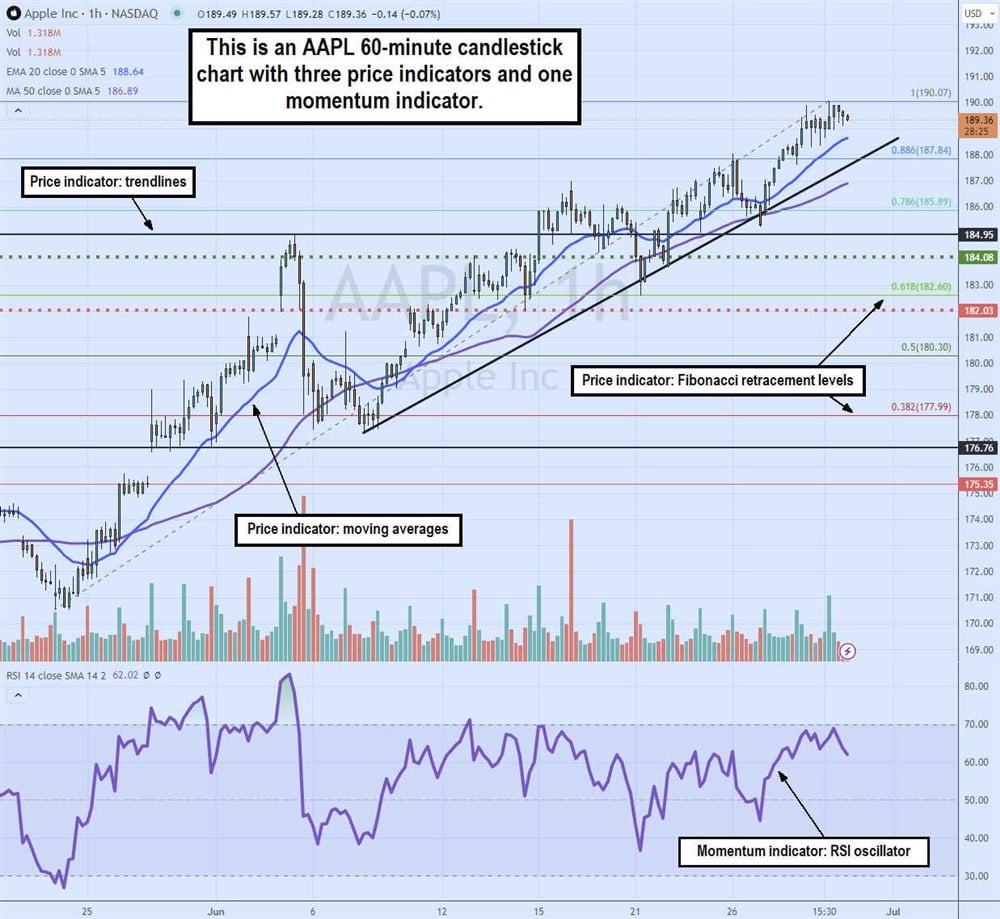
- Bollinger Bands (BBs): Market technician John Bollinger created This essential price indicator. It visualizes the trading range, compression, and expansion stage that stock prices go through. It's comprised of three "envelopes" or volatility bands. The upper envelope (the upper Bollinger Band) indicates the upper trading price range, and the lower envelope (BB) indicates the lower trading price range of the stock. The middle band is a moving average, usually 20 periods. The upper and lower BBs typically have two standard deviations.
- Fibonacci retracement levels (Fibs): Fibonacci retracement levels are static horizontal lines representing potential pullback support levels based on a derivation of the Fibonacci sequence to produce Fibonacci ratios. The most significant pullback reversals tend to occur on the 0.618 or 61.8% retracement and the 0.382 or 38.2% retracement levels.
- Moving averages (MA): These are prevalent price indicators that help determine the trend, support and resistance levels. Moving averages are dynamic lines connecting and smoothing the average trade price over the selected periods and chart time frame. These update every time increment of the chart. They are commonly used with two MAs comprised of a lead MA like the five-period simple moving average and a laggard like the 15-period simple moving average. Many traders like to play the crossover method of signals on breakouts and breakdowns. When the five-period MA crosses up through the 15-period MA, it illustrates a breakout. A breakdown occurs when the five-period MA crosses down through the 15-period MA.
- Relative strength index (RSI): This momentum oscillator measures the velocity of the underlying stock move and shows when a stock is overbought or oversold. The scale has bands ranging from zero to 100 on the Y axis. When the RSI oscillator rises through the 70-band, it's considered overbought. When the RSI oscillation falls below the 30-band, it's considered oversold. It's considered a reversal trigger when the RSI oscillation reverses through those levels. Learn more in-depth about the relative strength oscillator in this guide and video on MarketBeat.
- Stochastic: This is a popular momentum oscillator comprised of two oscillators, %K and %D slow. The %K is the lead oscillator, followed by the %D slow. Like the RSI, it has overbought levels above the 80-band and oversold levels below the 20-band. Reversal signals trigger when the %K crosses over the %D slow at the 20-band up or 80-band down. Typical configurations take three inputs, the %K and %D slow and smoothing.
- Trendlines: These are price indicators that help identify trends, support and resistance. They can also illustrate chart patterns. Trendlines are typically drawn manually on a chart using drawing tools. Most chart platforms have drawing tools enabling you to connect two points to form a trendline. Trendlines can be horizontal or diagonal. They tend to be drawn by connecting candlesticks or bar highs and lows.
Terms All Technical Analysts Should Know
Here are some technical analysis terms that traders commonly use. Familiarize yourself with the lingo so you are on the same page when talking charts and technical analysis way before you start interacting with online stock analysis tools.
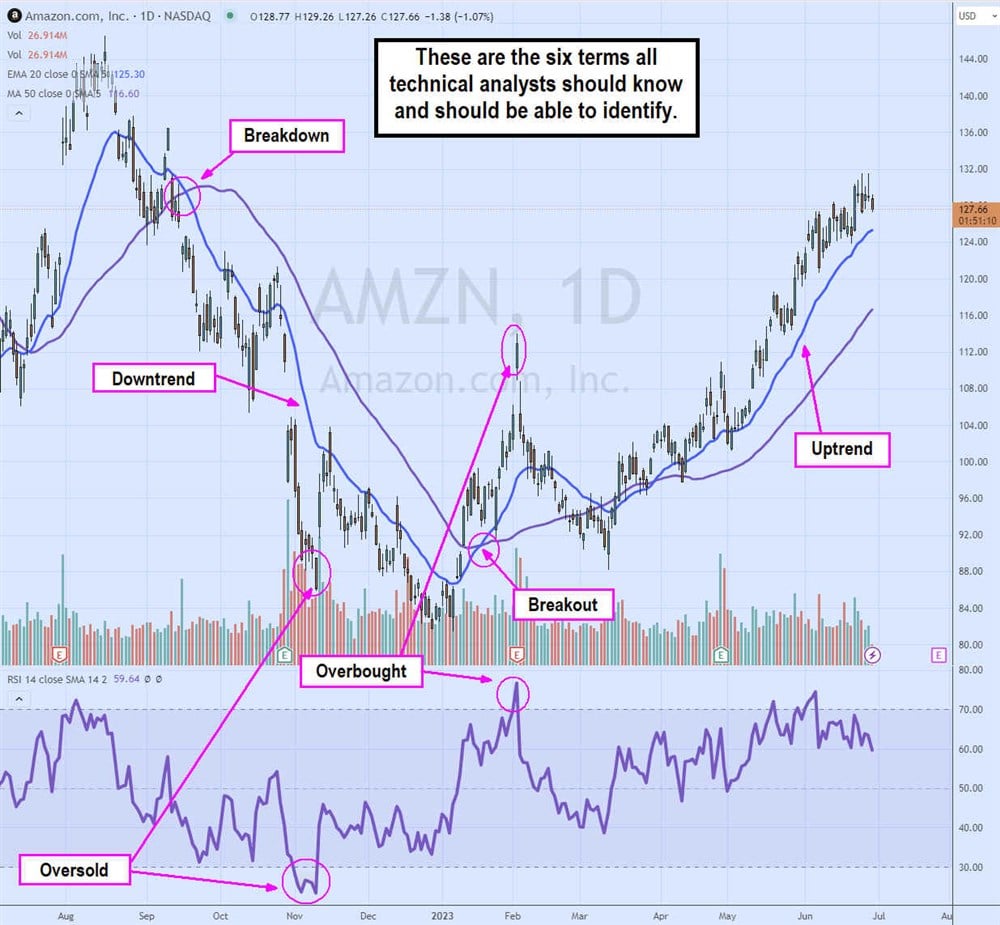
- Breakout: A breakout occurs when a stock rises through a resistance level. This tends to involve a rise in volume accompanying the price rise higher. It's often a sharp spike in the price through the resistance level while the pullbacks are higher. The sharp price spike shows anxious buyers jumping over each other to buy shares before the price surges even higher.
- Breakdown: A breakdown occurs when a stock falls through a support level. It tends to form on higher volume that accompanies the lower price. It's usually a sharp price drop indicating some panic selling, and bulls sell shares before they drop further.
- Consolidation: A consolidation is a sideways, rangebound and flat price range. Consolidations tend to precede breakouts and breakdowns. Volume is light during consolidations as participants have moved to the sidelines as the stock "rests."
- Downtrend: Downtrends after the follow-through downward move comprised of lower lows on drops and lower highs on bounces. Downtrends proceed after a breakdown.
- Uptrend: Uptrends are rising price patterns comprised of higher highs on bounces and higher lows on pullbacks. Uptrend proceeds after a breakout.
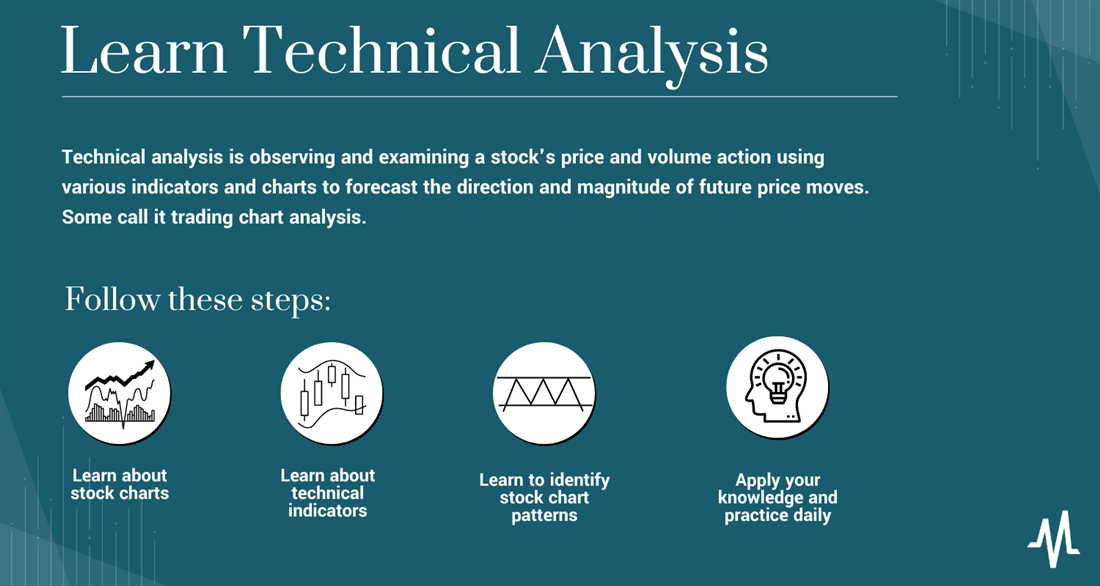
How to Learn Technical Analysis
You can learn technical analysis in five steps.
Step 1: Learn about stock charts.
First and foremost, learning all you can about stock charts is imperative. Technical analysis for beginnings starts with familiarizing yourself with stock charts. While there are many charts, including line, bar, point and figure and Heikin Ashi, you should start with candlesticks. Learn about what is a candlestick chart and how its functions. Learn about the parts of a candlestick and how a series of candlesticks can provide information about the price action.
Familiarize yourself with the different time frames. Different time frames will have different-looking trends and price patterns. Intraday traders tend to focus on intraday time frames like the one-minute, five-minute, 15-minute and 60-minute charts. Swing traders tend to focus on the 60-minute, daily and weekly charts. Long-term investors focus on daily, weekly and monthly time frame charts.
Step 2: Learn about technical indicators.
Charts alone can illustrate the history of the price action. However, you need to add technical indicators to derive more knowledge to help you make more informed trade decisions. Remember, there are two types of indicators, price and momentum. Common price indicator and momentum indicator combinations include moving averages and RSI. Bollinger bands help to visualize the trading range and whether a stock is experiencing compression or expansion.
Place the technical indicators on a candlestick chart and observe. Practice drawing trendlines to get used to marking up a chart. Some of the best apps for learning technical analysis will have advanced charting features like drawing trendlines.
Step 3: Learn to identify stock chart patterns.
As you get comfortable with the chart indicators, include studying chart patterns. Trading chart analysis involves learning about and spotting chart patterns. Some indicator-based patterns require indicators and price patterns that may only require a candlestick chart. There is a universe of stock patterns available to look for. Start with simple patterns that are easy to identify, like double-tops and double-bottoms and move on to more complex patterns, like triangles, head and shoulders and cups and handles.
Harmonic patterns like Gartleys, crabs and bats can be eccentric and complicated. To get started, try the definitive beginner's guide to reading stock charts for free on Marketbeat.
Step 4: Apply your knowledge and practice daily.
Practice, practice and practice daily. Study historical chart patterns and familiarize yourself with them in different time frames. Look for specific setups, like uptrends, breakdowns and downtrends. Look for chart patterns like triangles, rectangles, cup and handles and flags. The more you repeat the identification process, the better you will train your eyes to spot patterns as they form. The real goal is to be able to spot chart patterns as they form in real-time. This is how to study technical analysis one chart at a time.
Tips for Learning Technical Analysis
Here are some tips for learning technical analysis. You can use these tips from the get-go.
Build a Basic Foundation of Knowledge
Learn the indicators and terminology we covered earlier as a starting point. You will be using them frequently. Continue to study historical price patterns and learn to identify the basic patterns. For example, run through many stock charts and try to identify a bull flag and a bear flag.
Start with a Few Charts and Indicators
Start with candlestick charts and pick a price and a momentum indicator. For example, a 20-period moving average and an RSI are a good combination. Use that chart for the stocks you're watching. If you don't have a list of stocks, then consider the stocks in a benchmark index like the S&P 500 or the NASDAQ 100 index. Try to identify a link between peer stocks and the similar chart patterns they may share. It doesn't hurt to consider taking a technical analysis course through a reputable source.
Apply and Practice Technical Analysis
Technical analysis beginners can first compare charts between stocks in the same industry or sector to see how patterns repeat and duplicate among peer stocks.
Rinse and repeat. Technical analysis should be a filter you use when looking at stocks. Add more stocks to your watch list and notice the similarity between stocks. Keep track of the diverging stock patterns between similar and different stocks.
Look for pattern setups, note those stocks and observe how the pattern played out. Experiment with different time frames. Experiment with different indicators once you've gotten acclimated to the initial indicators. Swap them out and see which ones are best for you.
Example of Using Technical Analysis
Let's apply technical analysis to a Microsoft Co. (NASDAQ: MSFT) stock.
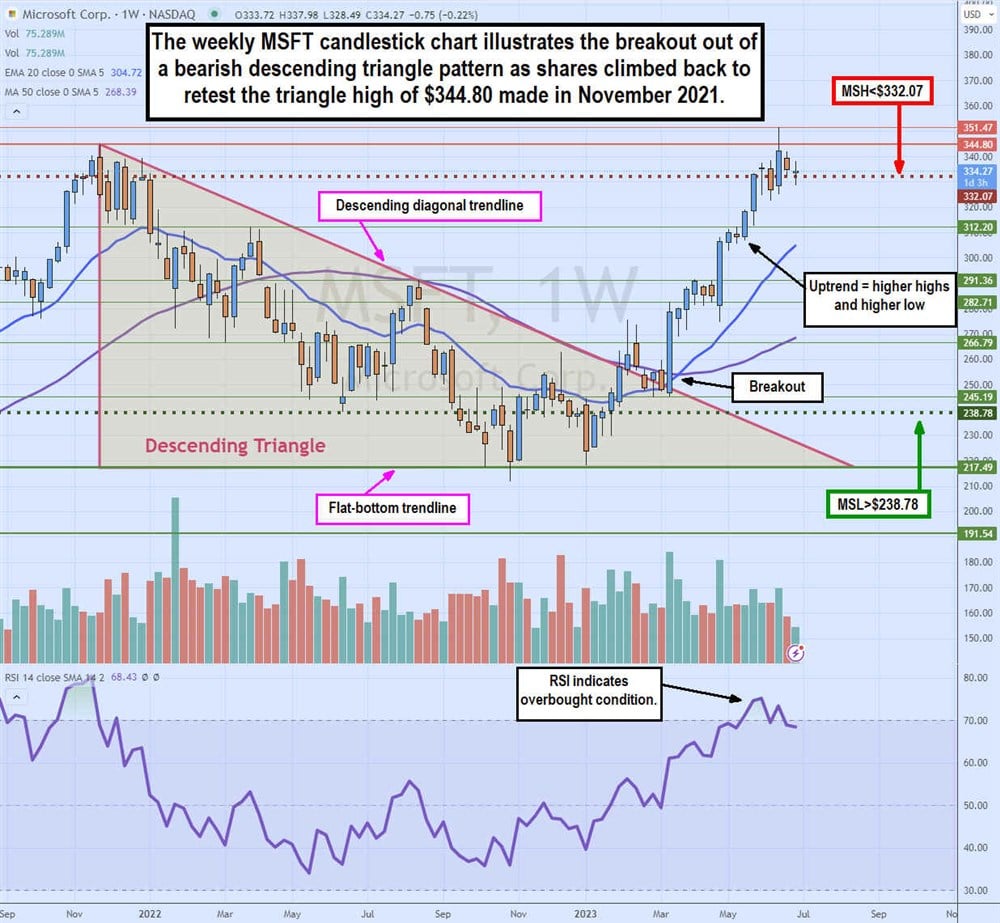
A weekly candlestick chart means a much more extensive price range. We can see that MSFT peaked at $344.80 in November 2021 and proceeded to sell off, making lower highs until forming a triple bottom forming a flat-bottom trendline at $217.49. Connecting the descending trendline with the horizontal flat-bottom trendline creates a descending triangle pattern. This bearish pattern forms as sellers sell at lower prices and buyers put in a floor. A flat-bottom breakdown occurs under $217.49.
However, we can see that MSFT broke through the descending trendline above $251 in March 2023. MSFT triggered the weekly market structure (MSL) buy signal on the breakout through $238.71 in January 2023. The breakout caused buyers to jump off the fence, driving shares up to $282.71 before taking a rest.
The weekly 20-period exponential moving average (MA) in blue is crossed over the weekly 50-period MA in purple to show the breakout. The uptrend proceeded afterward as MSFT climbed higher to test the triangle high at $344.80 nearly two years ago. MSFT rose to a high of $351.47 on eight higher high candles before a lower high candle formed afterward. This sets up the weekly market structure high (MSH) sell trigger if MSFT falls before the $332.07 low of the lower high candle. The RSI spiked above the 70-band twice and is starting to stall just under the 70-band, implying that a reversal sell-off profit-taking may be forming. The pullback support levels are the $312.20 horizontal trendline and the weekly 20-period EMA support at $304.70.
Learn Technical Analysis to Help You Trade
Technical analysis can be a great tool. Beginners tend to get overexcited and add too many indicators when they start. This can lead to a deer-in-the-headlights situation where many indicators may give different signals. This leads to analysis paralysis, the inability to decide on a trade because of too much noise from having too many indicators. This can be a real problem, especially if the indicators diverge. It's possible to overindulge with too many indicators on a stock chart that it creates unnecessary noise.
The key here is not to overwhelm yourself. The technical analysis encompasses a universe of indicators and thousands of charts to apply them. It would help to start with small pieces when faced with a large meal. The same applies to learning technical analysis. Start small with a limited number of charts and indicators and slowly add or switch them. Technical analysis is always a work in progress. The more you practice it, the better you will be at refining and optimizing your methodology.
FAQs
Here are answers to some frequently asked questions about technical analysis for beginners.
Is technical analysis easy to learn?
Technical analysis can be easy if you take it slowly and thoroughly initially. As you gain more knowledge, it gets easier. Your ability to eyeball patterns improves with repetition and practice. Like any endeavor, it gets easier once you get proficient. You can learn if you have a general interest or passion for learning it. Remember, it's a continuous learning process. When asking, "How can I learn technical analysis?" the answer is slowly and thoroughly.
How much time does it take to learn technical analysis?
This depends on your history and penchant for the stock market. You can learn quicker if you genuinely desire a better way to analyze stock prices. There is a learning curve. You can learn the basics in a matter of weeks. You can build a good foundation in months if you continue practicing applying it. Build upon that foundation as you experience the patterns and use the indicators throughout a lifetime of learning.
What is the best way to learn technical analysis?
The best way to learn technical analysis is to start slowly and thoroughly with the basics. Learn the concepts and the mechanics behind price patterns. Start with a single chart, indicator and a handful of stocks to analyze. Progress slowly and continue to practice and repeat, looking for set-ups and explaining the price history for your stocks daily. To get started, try the definitive beginner's guide to reading stock charts for free on MarketBeat.
Before you make your next trade, you'll want to hear this.
MarketBeat keeps track of Wall Street's top-rated and best performing research analysts and the stocks they recommend to their clients on a daily basis.
They believe these five stocks are the five best companies for investors to buy now...