But what is a correction in the stock market exactly, and how can you anticipate it? Read on to learn more about what causes a market correction and how to prepare for the next one.
What is a stock market correction?
A market correction is a term used in finance to describe a relatively short-term, downward movement or decline in the prices of financial assets. A market correction differs from a recession, bear market or crash thanks to its shorter and relatively less severe — when an asset declines in value by at least 10% but less than 20%, it’s considered a correction.
Market corrections help adjust asset prices that may have become overvalued or inflated during a bull market and may represent investors taking profits. However, they can also offer This article will explain the importance and causes of market corrections for investors and new traders.
Historical context
Understanding recent market corrections can provide investors with more insight into the relevance of anticipating market crashes. A recent example of a market correction occurred in 2018 when the value of the S&P 500 fell by more than 10%.
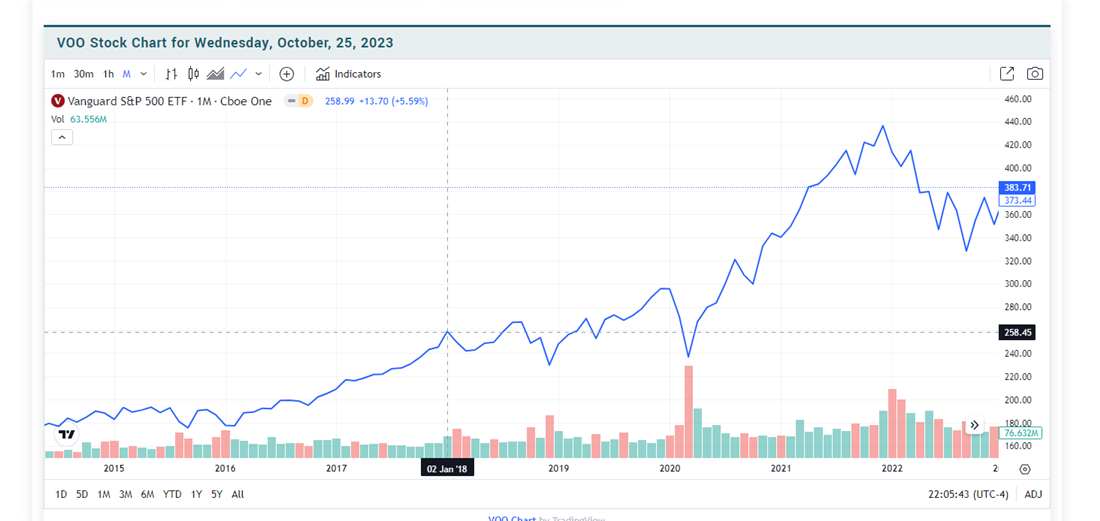
One key trigger was the expected and actual increase in interest rates by the U.S. Federal Reserve. As the Federal Reserve began raising interest rates to combat potential inflation and normalize monetary policy after the global financial crisis, investors grew concerned about the impact of higher borrowing costs on corporate profits and economic growth. Higher interest rates and reduced consumer spending negatively affect corporate profits and cause a significant reduction in stock and bond prices.
This correction, which occurred in early 2018, led to a rapid decline in stock prices, with the S&P 500 and other major indices temporarily decreasing by more than 10%. However, it's important to note that this correction was relatively short-lived, and the market rebounded in the subsequent months. This example illustrates the importance of stock market corrections — like most corrections, the decline in pricing was over before the beginning of the following quarter.
Causes of market corrections
A stock market correction may have a variety of causes, including both economic and psychological factors.
Economic factors
Certain economic factors can lead to a market correction, mostly associated with consumer spending and corporate lending ability.
- Inflation: Inflation refers to the general increase in prices of goods and services over time. High and accelerating inflation can be a concern for financial markets because it erodes the purchasing power of money, leading to decreased corporate profits. When investors anticipate rising inflation, they often demand higher returns on their investments to compensate for the loss of real purchasing power. Central banks may respond to high inflation by raising interest rates, which can further impact financial markets and economic activity.
- Unemployment: High unemployment rates can signal economic weakness and lower consumer spending. When people are out of work or fear job loss, they spend less, impacting business revenues and profitability. This can lead to reduced corporate earnings, which can, in turn, lower stock prices.
- Interest rates: When central banks raise interest rates to combat inflation or cool an overheated economy, it can increase the cost of borrowing for businesses and consumers. Higher interest rates can lead to reduced consumer spending, slower business investment and decreased corporate profitability, all of which can contribute to a market correction.
- Government policies: Government policies and regulations, such as tax changes or new financial regulations, can affect corporate profits and trade dynamics. Sudden or unexpected policy changes can introduce uncertainty and disrupt financial markets, leading to a sudden influx of investors taking profits.
Psychological factors
Similar to economic factors, how investors interpret market signals can also affect the severity of a stock correction.
- Investor sentiment: When a market index value falls, investors will look at current news headlines to determine the cause. If it appears that the cause of the downturn will be severe or long-term, investors may want to pull out of the market, leading to compounding losses that can also spill into other sectors. This self-fulfilling prophecy can turn a correction into a bear market if it is long enough.
- Loss aversion: Loss aversion is the idea that investors fear losses more than they appreciate gains. Comparing previous bear and bull markets indicates that the compounding powers of bearish sentiments may be stronger than those of bullish markets. Remember, if you're close to exiting the market and need to be mindful of short-term loss potential.
- Liquidity concerns: Fear of a lack of liquidity in the market can drive investors to sell rapidly during corrections, exacerbating the decline. You may want to monitor average daily volume changes to anticipate a correction's severity.
- Market news and their interpretation: News and events, whether real or perceived, can strongly influence investor sentiment. A sudden geopolitical event or corporate scandal can trigger fear and uncertainty, leading to market corrections or strengthening existing corrections.
The bottom line? Investors often follow the crowd, especially in times of uncertainty. When many investors start selling due to fear or negative sentiment, it can trigger a cascade of further selling, amplifying the correction.
Identifying a market correction
Learning how to identify market corrections can be difficult. Like detecting a bear market or bull market, it's much harder to determine if a negative market turn is a correction or a more severe event until looking back in hindsight. For example, many economists' estimates about the effect of COVID-19 on the housing market were incorrect, with losses compounding based on negative investor sentiment.
While hindsight will always be 20/20, a few indicators you can look for in both the fundamental and technical analysis categories may indicate a market correction is coming.
Technical analysis
Technical indicators can be valuable tools for identifying potential market corrections and understanding market dynamics. One of the most commonly used indicators for detecting when a stock market correction is coming is the moving average convergence divergence (MACD). The MACD measures the convergence and divergence of two moving averages, which can provide signals for trend reversals preceding corrections.
Pay close attention to bearish divergence patterns in major stock indexes like the S&P 500. Look for instances where the MACD and the price chart move in the same direction but with differing momentum characteristics. In particular, focus on situations where the price is making higher highs while the MACD is making lower highs (a "regular" bearish divergence) or where the price is making lower lows while the MACD is making higher lows. These bearish divergence patterns suggest weakening momentum in the prevailing trend and can be a warning sign of a potential correction.
You can also use an index's relative strength index (RSI) to help predict when a market correction might be coming. The RSI measures the speed and change of price movements, providing insights into overbought and oversold signals. Monitor RSI levels that exceed 70, which typically indicate overbought conditions, potentially preceding a correction. Conversely, an RSI below 30 suggests oversold conditions, which could signal a potential rebound.
Additionally, look for divergences between RSI and price movements. For example, if the price is making higher highs while the RSI is making lower highs, this bearish divergence may indicate weakening momentum and foreshadow a correction.
Fundamental analysis
In addition to technical analysis, fundamental analysis of corporate earnings and reports can also help you predict a coming market recession. For example, earnings reports provide a direct insight into a company's financial health and performance. Positive or negative surprises in earnings can significantly impact investor sentiment and stock prices.
A sudden decline in corporate earnings or missed earnings expectations can be an early warning sign of an economic slowdown or a potential market correction. Investors often react negatively to earnings disappointments, selling off stocks and contributing to market corrections. You may be able to predict a coming correction by comparing progressive earnings reports of major companies in the sectors you invest in. MarketBeat offers a comprehensive guide on how to read an earnings report.
When predicting a recession, consider the price-to-earnings (P/E) ratio. P/E ratios reflect the market's valuation of a company's stock relative to its earnings, with high P/E ratios potentially signaling overvaluation. It signals that a stock could be prime for a correction, with investors comparing actual returns to the price they paid per share. Because the average P/E ratio varies by industry, comparing this data to other companies in the same sector or previous data is important.
Strategies during a market correction
Market corrections are a normal part of the financial cycle and shouldn’t cause you to panic sell. Managing a healthy portfolio of diversified investments and understanding the psychology of the bear market can help you trade well through a correction.
Risk management
Risk management is essential to sustaining your investments through periods of loss. Before entering a correction, it's essential to diversify your investments across multiple companies or asset classes. A well-balanced portfolio can help mitigate the impact of a correction in any one asset class, leading to fewer overall losses in your total portfolio.
You can also diversify the types of investments in your portfolio as well for a greater level of protection. Use assets like ETFs and bonds to complement and balance stocks, crypto or other higher-risk assets in your portfolio. Different assets come with different levels of risk involved, making it important to adjust your portfolio asset classes to manage risk as you come closer to retirement or another major financial goal.
You might consider implementing a stop-loss order if you use a short-term investment strategy and need to manage corrections. Stop-loss orders automatically exit your position once an asset reaches a predetermined loss level set by the account owner. Consider using trailing stop-loss orders that also adjust with the market's movements. These order types allow you to lock in profits while allowing the position to run in a bullish trend and limit losses during a correction.
Investment opportunities
While a market adjustment can seem scary if you're getting close to needing to liquidate your account, these corrections also provide room and opportunities for growth. Asset prices often decline during a correction, creating the potential for acquiring undervalued assets. One strategy for identifying undervalued assets is to focus on fundamental analysis. Look for companies with strong, consistent financial earnings reports and a history of earnings growth. These companies may be well positioned for a rebound once the correction ends.
Pay attention to sectors that may have been oversold during the correction but have strong long-term prospects. Dividend stocks can be appealing, as they often offer income and stability. Dollar-cost averaging is another useful approach, where you invest a fixed amount at regular intervals to buy more shares when prices are low. You may also want to use the technical analysis indicators highlighted above to identify and strike new market opportunities.
Case studies
As you examine the S&P 500 correction history, you'll notice that corrections are a relatively normal occurrence. Let’s look at the total market correction that occurred in early 2018 due to investor fears related to federal actions against inflation. While most companies and sectors suffered during this period, banking and finance-related companies tended to see the hardest hits.
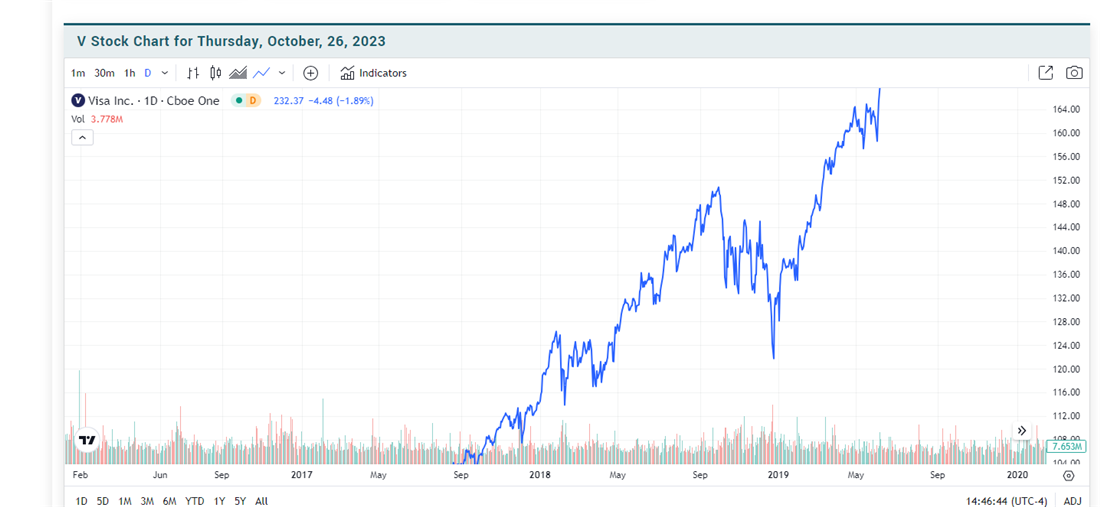
Like most other finance stocks, Visa (NYSE: V) saw a sharp decline in stock price in early 2018. The stock moved from about $126 per share to about $114, representing a decrease in value of about 9.5%.
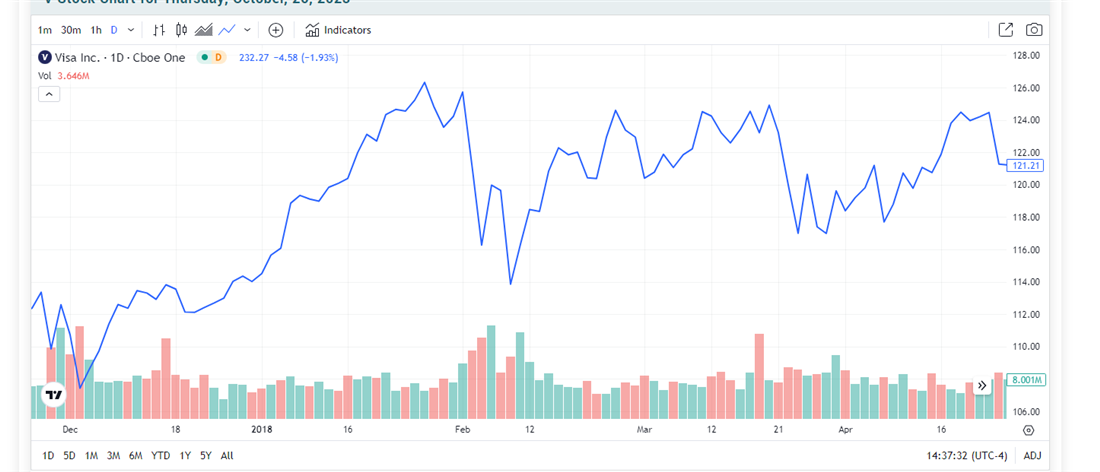
Investors who held their stock through this period of uncertainty (or purchased more during the decline) saw significant gains after the correction was over. In February 2019, one year after the correction, Visa stock was valued at about $144 per share, representing an increase of more than 14% post-correction.
Surviving a market correction
The most important thing to remember about a market correction is that it can be challenging to predict before you benefit from hindsight. If you aren't sure if we're in a recession, correction or another market downturn, it's usually better to maintain your holdings rather than liquidate.
Attempting to time the market may lead to more losses than if you'd allowed your stocks to shift in value over time.
Before you make your next trade, you'll want to hear this.
MarketBeat keeps track of Wall Street's top-rated and best performing research analysts and the stocks they recommend to their clients on a daily basis.
They believe these five stocks are the five best companies for investors to buy now...