If you’re learning to navigate financial markets, you're probably surprised by how much the Greek alphabet comes into play with different asset classes. Traders must consider four factors named after Greek letters (like delta or theta). All active investors look for alpha, which means outperformance compared to traditional market averages. But if alpha means outperformance, what is beta in stocks?
Deductive logic would indicate that the beta of a stock would refer to underperformance. However, that’s not what beta measures. In this article, you’ll learn the beta meaning, its formulation and how to use beta in stock market analysis.
What is Beta?
What does beta mean in terms of stock analysis? Beta is simply a measure of the volatility of one asset compared to another, like shares of Zillow Group Inc. NASDAQ: Z versus the S&P 500. The first asset is usually an individual stock, fund or commodity, and the second is a benchmark index for comparison with a larger base.
Stocks that are more volatile than the index will have a higher beta; stocks that are less volatile than the benchmark will have a lower beta. Beta is a crucial component in the Capital Asset Pricing Model (CAPM) and can be used to measure the risk of an investor’s portfolio versus the overall market.
To further illustrate the stock beta meaning, consider the assets in an index as cars racing down a congested highway with the benchmark as the road's center line. Cars may drift away from the center line at various rates as they head toward their destination. Sticking toward the center line might be safer, but some cars are willing to sacrifice a little safety and move away from the line if it gets them to their destination faster.
Replace cars with stocks in the above analogy, and you’ll have a clearer picture of how stock beta works. Investors using beta in stock market research are usually comparing individual stock volatility to the volatility of benchmark indices like the Dow Jones Industrial Average (DJIA) or S&P 500. Gyrating growth stocks like tech giants Tesla Inc. NASDAQ: TSLA or NVIDIA Corp. NASDAQ: NVDA will have a higher beta than stocks in slow-moving sectors like utilities or consumer staples.
How to Calculate Beta
What is beta in the stock market? You can find the beta coefficient by dividing the covariance and variance:
- Covariance: The asset’s return compared to the overall market or benchmark return, such as NVIDIA’s returns compared to the S&P 500.
- Variance: The overall market or benchmark return across a specific time frame.
The formula for finding the beta coefficient is as follows:
Beta = Covariance (Stock Return, Market Return) / Variance (Market Return)
The resulting beta coefficient will be greater than or lower than 1 since 1 equals the market return (i.e., the annual average return of the S&P 500). Since a single integer represents beta, it’s easily interpreted and factored into stock and portfolio analysis. You can easily recognize a beta of 1.35 as 35% more volatile than its benchmark.
What is a Good Beta for a Stock?
Like most investing factors, the definition of a good beta in a stock depends on each investor's goals, risk tolerance and timeline. High- or low-beta stocks aren’t necessarily good or bad; they move in different fashions. Since the benchmark is always 1 in the beta calculation, high beta stocks will have a value greater than 1, and low beta stocks will have a value lesser than 1.
High vs. Low Beta
High-beta stocks are more volatile than low-beta ones, but high beta doesn’t mean higher gains or deeper losses; it's simply a measure of how much the stock’s volatility deviates from the market average. High-beta stocks can outperform the market, underperform the market or even match the market return over time if the route getting there is circuitous enough.
Likewise, low-beta stocks may be less volatile than the market but could still outperform or underperform market averages over the specified period. All that matters to beta is deviation, not direction.
Example of Beta
If you’re still asking, "What is alpha and beta in stocks?" here’s an example to help better expand the concept.
Imagine you’re a long-term investor constructing a portfolio for a Roth IRA you plan on tapping in 20 years. You don’t want to take excessive risk in the portfolio, but you’re willing to withstand a little volatility to outperform the S&P 500.
How much volatility can you withstand? If beta measures the overall volatility of the S&P 500 as 1, you might consider stocks with a beta of 1.2 or 1.3. A stock with a beta of 1.2 will be 20% more volatile than the S&P 500 benchmark, while a 1.3 beta stock is 30% more volatile. This is a good range, so let’s look for a stock with a beta between 1.2 and 1.3. What better stock than the biggest one on the planet: Apple Inc. NASDAQ: AAPL?
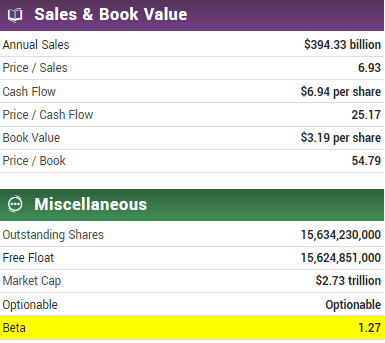 In addition to an eye-popping $2.73 trillion market cap, AAPL shares have a beta of 1.27, which nicely fits the criteria we’re looking for. Adding AAPL shares to our market-neutral IRA will increase the overall portfolio's volatility but within acceptable parameters.
How to Interpret a Stock’s Beta
What is stock beta used for in terms of portfolio analysis? It’s tempting to just look at the number on your brokerage’s app or website and assume you know how volatile that particular stock or asset is. But those assumptions require verification because beta isn’t universal.
A stock with a beta of 0.9 is less volatile than its benchmark, but what is the benchmark? Most investors assume the S&P 500 is the benchmark when looking at stock prices. However, would you use the S&P 500 to measure the volatility of corporate bonds? These assets aren’t very similar; any correlation between them would be hard to justify. When researching assets, ensure you know the benchmark used as a variable in the beta equation.
Next, what’s the time frame? Stocks tend to be more volatile in the short term but produce relatively consistent returns over time. Suppose you’re a day or swing trader. In that case, you’ll be more interested in short-term beta measurements since you have significantly shorter time horizons than a long-term investor planning for retirement.
The beta formula is useful because many different timeframes and benchmarks can measure an asset’s volatility. Still, you need to be certain of the variables in the calculation before using it as a tool. Suppose you know a stock's 0.9 beta was found by using the S&P 500’s average five-year return as a benchmark. In that case, you can decide whether its volatility profile matches your portfolio prerequisites.
Pros and Cons of Beta
Beta can be a useful heuristic for volatility when considering whether to add a particular stock to your portfolio, but there are benefits and drawbacks. Here are the pros and cons of beta as a stock analysis metric:
Pros
The pros of beta include:
- Useful across asset classes: Most investors use beta to compare a stock’s volatility against the S&P 500, but you can use it on a wide range of assets and benchmarks. For example, a recent paper from Vanguard studied how beta in a basket of commodities rose during periods of unexpected inflation. You can use beta to measure volatility in more asset classes than stocks.
- Simple variable to include in analysis: The formula for beta might be daunting to calculate. Still, the variable it produces is simple, recognizable and can be factored easily into portfolio analysis. If you’re looking for a portfolio beta of 1 relative to the S&P 500 and you’ve fallen below that benchmark, you know you’ll need to add equities with a beta higher than 1 to bring your portfolio back into your preferred balance.
- Flexible and malleable: Beta investing strategies are diverse because you can use the metric to measure any particular asset against any benchmark; it's up to the investor to decide if the resulting data is useful. Beta can measure the volatility of gold or oil against a basket of commodities, or the relationship between USD and JPY, or simply estimate how much additional risk is applied to a portfolio when inserting a volatile stock like AirBNB Inc. NASDAQ: ABNB with a beta of 1.29 or conservative utility like Duke Energy Corp. NYSE: DUK with a beta of 0.43.
Cons
The downsides include:
- Backward-looking data: Investors use metrics to predict where stocks are going, but the unfortunate reality is that most data is backward-looking. Market technicians simply hope the past repeats itself. Beta uses previous price data to measure volatility compared to the index or market, but there’s no promise that this data will be useful in predicting a stock’s future path.
- Beta can change over time: No technical tool or analysis metric is useful forever, and coefficients like beta frequently change over time or in different market conditions. For example, a bank panic like the collapse of Silicon Valley Bank triggered a wave of bank stock volatility. However, this was a one-time catalyst that didn’t hold much sway over the long-term futures of other similar-sized banks. On the other hand, formerly volatile startups occasionally turn into large-cap behemoths, which is the path tech giants like Meta Platforms Inc. NASDAQ: META and Uber Technologies Inc. NYSE: UBER followed.
- Reveals nothing about underlying business: Beta tells us what happened but gives little insight into the why. Like the example above, an investor who hadn’t read the news would have no idea why the beta of regional bank stocks suddenly went through the roof. Likewise, suppose a company becomes volatile due to scandal, accounting issues or C-suite departures. In that case, that stock’s beta will reflect the price gyrations but won’t tell an investor about any underlying issues causing the volatility.
How to Use Beta to Invest and Trade
Short-term day or swing traders or long-term investors can use beta. In the example above, we showed how to use beta to adjust the overall volatility of a portfolio by adding a stock within a particular beta range. In this scenario, beta is a diversification tool. Using beta allows investors to adjust the risk profile of their portfolio through a metric with simple values that are easy to interpret.
But what about day and swing traders? Beta can also be a screening tool for short-term traders since day and swing trading requires volatile assets with prices that move quickly (i.e., penny stocks). And since short-term traders can profit from big swings in either direction, you can use beta in multiple-day and swing trading strategies.
Measures a Stock’s Volatility Versus a Benchmark Average but Tells Little About the Underlying Asset
Beta is an integral part of the capital asset pricing model, and all traders and investors use it. Instead of attempting to predict the directional movement in an asset’s price, beta gauges volatility as a measure of deviations from a mean, which is usually a benchmark index like the S&P 500. Beta can evaluate risk by comparing a stock’s price movements against an individual portfolio and expressing how much volatility that particular stock will add to the asset base.
However, it’s also important to understand what beta doesn’t tell investors. Beta measures volatility but doesn’t give clues about the direction of the price movement. A stock with a beta of 1.75 is 75% more volatile than the market average, but is that upside volatility? Downside? A massive web of movement that eventually winds up close to the original price?
You won’t learn the answer using this metric. Beta is a useful tool, but you must use it with other metrics and indicators to find ideal investment opportunities.
Before you consider Apple, you'll want to hear this.
MarketBeat keeps track of Wall Street's top-rated and best performing research analysts and the stocks they recommend to their clients on a daily basis. MarketBeat has identified the five stocks that top analysts are quietly whispering to their clients to buy now before the broader market catches on... and Apple wasn't on the list.
While Apple currently has a Moderate Buy rating among analysts, top-rated analysts believe these five stocks are better buys.
View The Five Stocks Here
Learn the basics of options trading and how to use them to boost returns and manage risk with this free report from MarketBeat. Click the link below to get your free copy.
Get This Free Report
Like this article? Share it with a colleague.
Link copied to clipboard.