Traders are still looking for options when it comes to indicators. There are so many technical indicators out there that it can be overwhelming, especially if you are a developing trader searching for an indicator that makes sense to you and compliments your strategy. Some favorites and most popular technical indicators include Moving Averages, Fibonacci Lines, Bollinger Bands, and the MACD, to name a few.
However, it might surprise that many professional traders and institutions don’t bother with the above indicators. Instead, they use a straightforward indicator to gain insight into an individual stock’s strengths, weaknesses, and overall trends. An indicator that shows them whether the buyers or sellers are in control. Of course, I am talking about the Volume Weighted Average Price (VWAP) indicator.
What is VWAP?
The VWAP identifies the average price a stock has traded based on volume and price during a specified period. The indicator will show the average price a stock has traded the most volume at throughout the day.
As mentioned briefly above, the indicator is used by several market participants, for various strategies and purposes, like traders, institutions, hedge funds, and portfolio managers. For example, an execution trader for a hedge fund might use the indicator and an algorithm to build a long or short position in a stock throughout the day at VWAP.
An objective of the execution trader for a fund or institution might be to accumulate a significant position over time without impacting the stock price. Therefore, they will run a VWAP execution algorithm that purchases shares just below, above, or at VWAP.
A day trader will use the indicator for several different reasons and advantages. A trader might use VWAP to indicate whether buyers or sellers are in control of the day and then use VWAP for entry, exits, and risk management.
The indicator is calculated by totaling the dollars traded for every transaction (price multiplied by the volume) and dividing by the total shares traded.
How Traders Use the VWAP
Traders use the indicator for a variety of different reasons. Namely, to identify support and resistance, possible entry and exit areas, strengths or weaknesses of a stock, and risk management.
- Support and Resistance: If a stock is trading near and above VWAP, and trending higher, with the VWAP tested multiple times throughout the day as the stock has made higher lows, the indicator will represent critical support. If the stock fails to hold the VWAP on a retracement and breaks below, then VWAP turns from support into resistance. The longer VWAP acts as support or resistance, the more weight is attached to it as support or resistance for that particular stock. A break of VWAP after multiple days of holding above would signal a critical momentum shift.
- Entry and Exits: Adding to the above, as VWAP can represent critical support and resistance levels and areas, it can also be used by short-term traders for entry and exits. For example, if a stock is consistently trending below an intraday VWAP and puts in lower highs in the downtrend, failing at a declining VWAP throughout the day, a short-term trader can use the lower high VWAP fail as an entry spot to get short. The same applies to going long if a stock is trending higher and using VWAP as support for entry. If a stock greatly extends from the VWAP to the upside or downside, it could represent an intraday blowoff or downside capitulation and provide confirmation and reason to either exit a long, in the event of a blowoff or enter a long, in the event of a capitulation.
- Strength and Weakness Identification: how a stock trades relative to VWAP will provide valuable insight. Specifically, what side of VWAP it is trading on, how great it has extended from VWAP, and how many times it has been tested and held will provide clues into the strength or weakness of the stock. A stock consistently trading above a multi-day VWAP will signal significant accumulation and outlier strength.
- Risk Management: VWAP can enable a trader to manage risk systematically. For example, if a trader is long a stock that has held over VWAP while trending higher, the trader can trail his stop using a rising VWAP or set a stop loss below the previous higher low under VWAP. VWAP, therefore can identify a shift in momentum and confidently represent an area that invalidates a position, whether long or short.
An Example of Trading Using VWAP
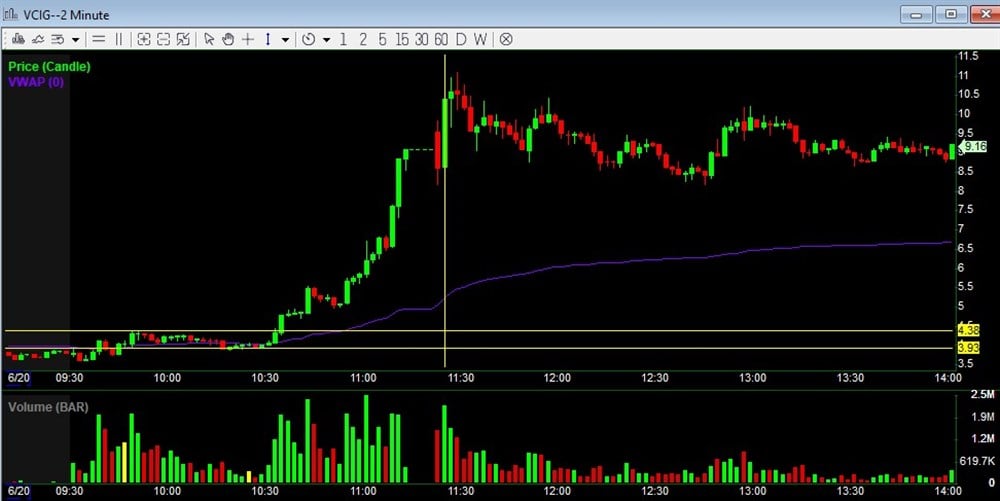
In the above chart of VCI Global (NASDAQ: VCIG), notice how, between the market open to 10.30 am, shares of VCIG traded steady near VWAP. Just after 10.30 am, volume increased, and the stock broke above the morning consolidation and held firmly above VWAP, indicating that buyers were stepping higher and firmly in control. VWAP provided information on who was in control, critical support, and where stops should be placed if a trader entered long.
Then, around 11.30 am, shares of VCIG extended significantly from the VWAP, signaling an intraday blowoff move and confirmation of an extension from VWAP and reason to exit a long position from the breakout above the morning consolidation and hold over VWAP. As the price extends from the mean on the day (VWAP), a trader can assume that supply will overtake demand, resulting in a pullback. For that reason, VWAP can be a powerful indicator of mean reversal opportunities.
The bottom line is that all indicators serve a purpose, and when paired correctly with the right strategy and trading system, it can significantly improve the outcome. VWAP, unlike many other indicators, can be paired with various strategies and trading styles, as it can broadly paint the picture of an individual stock’s overall trend and strength/weakness.
Over time, VWAP has proven to be a significant indicator with many advantages, specifically for short-term traders analyzing charts and price action. Therefore, this is an indicator that developing and experienced traders alike should familiarize themselves with and add to their toolbox.
Before you make your next trade, you'll want to hear this.
MarketBeat keeps track of Wall Street's top-rated and best performing research analysts and the stocks they recommend to their clients on a daily basis.
Our team has identified the five stocks that top analysts are quietly whispering to their clients to buy now before the broader market catches on... and none of the big name stocks were on the list.
They believe these five stocks are the five best companies for investors to buy now...
See The Five Stocks Here
Discover the 10 Best High-Yield Dividend Stocks for 2025 and secure reliable income in uncertain markets. Download the report now to identify top dividend payers and avoid common yield traps.
Get This Free Report
Like this article? Share it with a colleague.
Link copied to clipboard.