NFI Group (TSE:NFI - Get Free Report) had its price target reduced by equities research analysts at CIBC from C$23.00 to C$20.00 in a research report issued to clients and investors on Monday,BayStreet.CA reports. The firm presently has an "outperform" rating on the stock. CIBC's price target points to a potential upside of 27.88% from the company's current price.
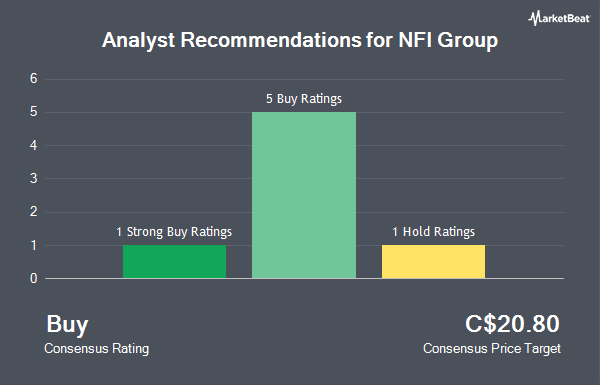
A number of other equities analysts have also weighed in on NFI. Stifel Nicolaus upped their price objective on NFI Group from C$22.00 to C$23.00 and gave the stock a "buy" rating in a research note on Tuesday, August 5th. BMO Capital Markets raised NFI Group from a "hold" rating to a "strong-buy" rating and upped their price objective for the stock from C$14.00 to C$23.00 in a research note on Thursday, July 17th. Finally, Scotiabank dropped their price objective on NFI Group from C$23.00 to C$22.00 in a research note on Monday. Two equities research analysts have rated the stock with a Strong Buy rating, four have issued a Buy rating and one has issued a Hold rating to the stock. According to data from MarketBeat, NFI Group presently has an average rating of "Buy" and an average price target of C$22.67.
View Our Latest Research Report on NFI
NFI Group Stock Performance
NFI traded down C$0.53 during midday trading on Monday, reaching C$15.64. The company had a trading volume of 417,219 shares, compared to its average volume of 286,031. The company has a quick ratio of 0.55, a current ratio of 1.71 and a debt-to-equity ratio of 171.59. The business has a 50-day moving average of C$18.47 and a two-hundred day moving average of C$15.76. The company has a market cap of C$1.86 billion, a P/E ratio of -11.44, a P/E/G ratio of -0.07 and a beta of 0.75. NFI Group has a 1 year low of C$9.83 and a 1 year high of C$19.90.
About NFI Group
(
Get Free Report)
NFI Group Inc is a Canadian automobile manufacturer. The company organizes itself into two segments: Manufacturing operations, and Aftermarket operations. Manufacturing operations, which represents more than half of the company's revenue, includes the manufacture of transit buses for public transportation, and motor coaches.
Recommended Stories
This instant news alert was generated by narrative science technology and financial data from MarketBeat in order to provide readers with the fastest and most accurate reporting. This story was reviewed by MarketBeat's editorial team prior to publication. Please send any questions or comments about this story to contact@marketbeat.com.
Before you consider NFI Group, you'll want to hear this.
MarketBeat keeps track of Wall Street's top-rated and best performing research analysts and the stocks they recommend to their clients on a daily basis. MarketBeat has identified the five stocks that top analysts are quietly whispering to their clients to buy now before the broader market catches on... and NFI Group wasn't on the list.
While NFI Group currently has a Buy rating among analysts, top-rated analysts believe these five stocks are better buys.
View The Five Stocks Here
Discover the 10 Best High-Yield Dividend Stocks for 2025 and secure reliable income in uncertain markets. Download the report now to identify top dividend payers and avoid common yield traps.
Get This Free Report
Like this article? Share it with a colleague.
Link copied to clipboard.