Beauty products and fragrance maker
Coty, Inc. NYSE: COTY stock has suffered with the benchmark indices trading down over (-30%) for the year. The Company is the leading fragrance maker with high-end brands including Hugo Boss, Burberry, Mark Jacobs, and Gucci in its portfolio. It also owns the iconic Cover Girl brand. The
pandemic lockdowns and work-from-home trend steamrolled the demand for make-up and fragrances but did bolster skincare products. As the reopening continues and people once against engage with each other person-to-person socially and professionally, the demand has been recovering. The Company continued to see growth in its fiscal Q3 2022 results with a top-line growth of 15.4% and raising its EPS guidance for the year. Travel
retail, U.S. and Europe drove strong sales momentum with both prestige and consumer beauty segments leading with sell-out performance.
E-commerce sales growth was in the double digits and the Company continues to grow its presence with social media platforms. It’s products continue to be the fastest-growing leading prestige business in
China despite the flat market backdrop. Fragrances are a market tailwind in the face of
inflationary and
supply chain pressure
headwinds. Prudent investors looking for a value play in the cosmetic and fragrance market can watch for opportunistic pullbacks in shares of Coty to build a position.
Q3 Fiscal 2021 Earnings Release
On May 9, 2022, Coty released its fiscal third-quarter 2021 results for the quarter ending March 2022. The Company reported an adjusted earnings-per-share (EPS) of $0.03 excluding non-recurring items versus consensus analyst estimates for a profit of $0.01, beating estimates by $0.02. Revenues rose 15.4% year-over-year (YOY) to $1.19 billion, beating analyst estimates for $1.15 billion. Sales momentum was strong fueled by both U.S. and Europe, and travel retail. Coty CEO Sue Nabi commented, "Our Q3 earnings mark the seventh consecutive quarter of Coty reporting results inline to ahead of expectations. I am extremely proud of the organization for delivering these results, and outperforming the overall beauty market, in an increasingly volatile environment. This confirms that Coty has the brands and the people to win in the beauty market, guided by our strategic priorities of delivering above-market sales growth and expanding gross margin, allowing for brand reinvestment, profit expansion and continued deleveraging.”
Raised Guidance
Coty raised its fiscal full-year 2022 EPS guidance to come in between $0.23 to $0.27 versus $0.27 analyst estimates including $0.01 of net discrete tax benefits.
Conference Call Takeaways
CEO Sue Nabi provided color on the performance. Strength was found in its Consumer Beauty segment as its continued to make global market share gain for the 5th consecutive month. Adidas repositioning is on track for late summer 2022. Its Prestige Brands cosmetics continue to deliver great results with brands including Gucci Beauty, Burberry, and Kylie. The skincare footprint continues to improve as Lancaster doing well in China with its iconic 365 Serum becoming the hero SKU in its portfolio. Its CoverGirl brand is making its first-ever entry into the skincare market. The premiumization of its Prestige and Consumer Beauty continues with price hikes to protect margins, retain talent, and maintain its flexibility with its supply chain.
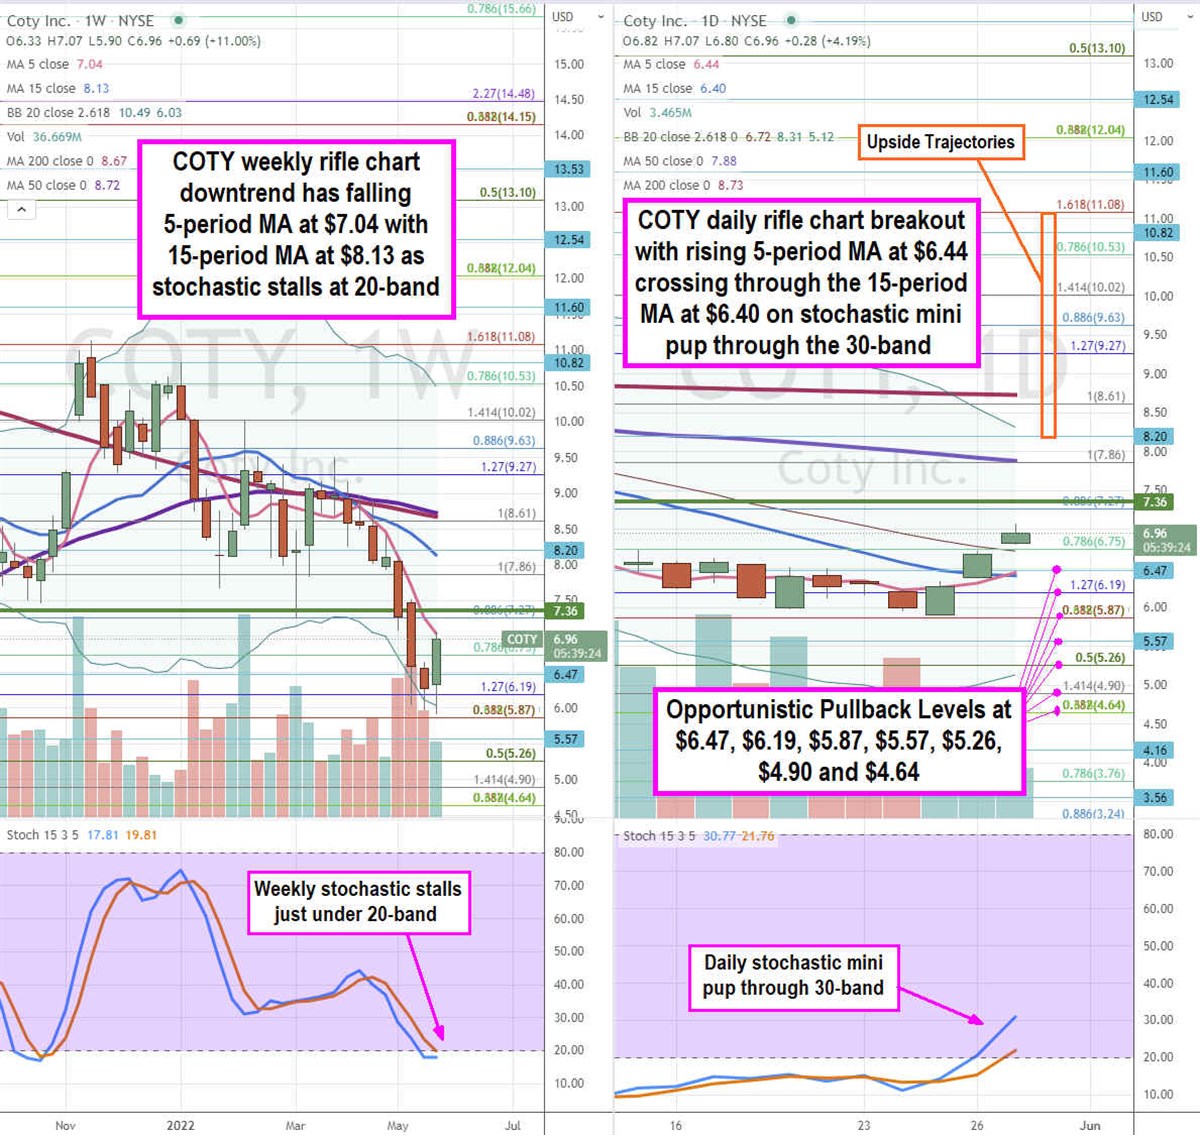
COTY Opportunistic Pullback Levels
Using the rifle charts on the weekly and daily time frames provides a precision view of the landscape for COTY stock. The weekly rifle chart peaked out near the $11.08 Fibonacci (fib) level. COTY triggered a breakdown after the peak as it broke down through the weekly 50-period moving average (MA) at $8.72 and weekly 200-period MA at $8.67 towards its weekly lower Bollinger Bands (BBs) at $6.03. The weekly falling 5-period MA is at $7.04 followed by the 15-period MA at $8.13. The weekly stochastic fell under the 20-band but is stalled for either a cross back up or a mini inverse pup back down. The weekly market structure low (MSL) buy triggers above $7.36. The daily rifle chart has a breakout as the 5-period MA at $6.44 crossed up through the 15-period MA at $6.40 and the stochastic has a mini pup through the 30-band. The daily 50-period MA sits at the $7.86 fib and daily upper BBs at $8.31 with the daily 200-period MA at $8.73. Prudent investors can look for opportunistic pullback levels at the $6.47, $6.19 fib, $5.87 fib, $5.57, $5.26 fib, $4.90 fib, and the $4.64 fib level. Upside trajectories range from the $8.20 level up towards the $11.08 fib level.
Before you make your next trade, you'll want to hear this.
MarketBeat keeps track of Wall Street's top-rated and best performing research analysts and the stocks they recommend to their clients on a daily basis.
Our team has identified the five stocks that top analysts are quietly whispering to their clients to buy now before the broader market catches on... and none of the big name stocks were on the list.
They believe these five stocks are the five best companies for investors to buy now...
See The Five Stocks Here
Click the link to see MarketBeat's list of seven stocks and why their long-term outlooks are very promising.
Get This Free Report
Like this article? Share it with a colleague.
Link copied to clipboard.