The Consumer Price Index (CPI) is the inflation gauge. Inflation is the rate at which prices are rising and in turn eroding your buying power. It’s released by the
U.S. Bureau of Labor Statistics (BLS) on a monthly basis. It measures the average rate of change in prices paid by consumers for a basket of products and services compared to the year ago period. The core CPI report doesn’t include food and energy, that’s separate. The report contains pricing data by industries and locations to derive a general overall CPI figure. The report is released monthly for the prior month’s data (IE: August CPI data is reported in September). The CPI reached a
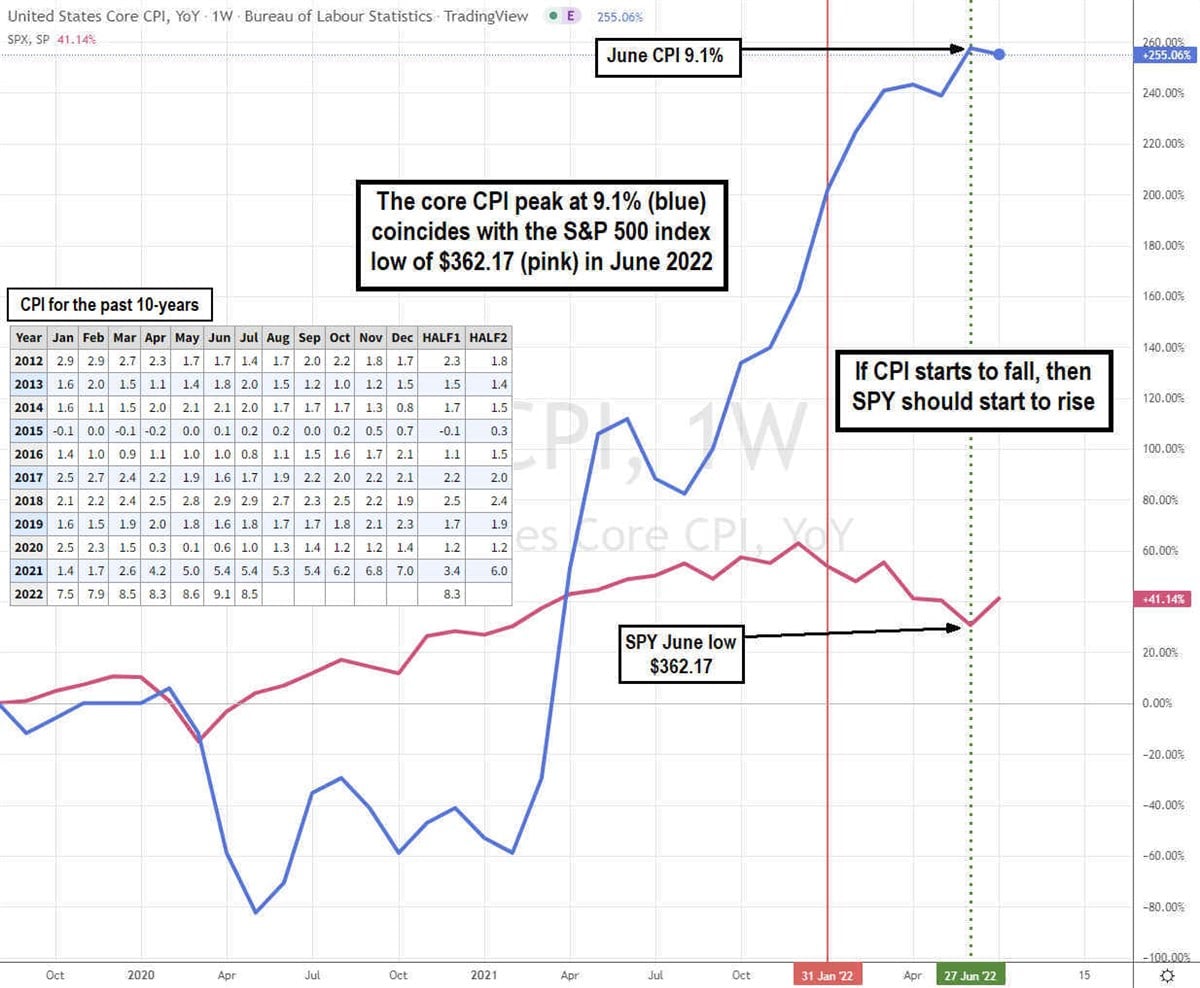
40-year high of 9.1% in June 2022 indicating the possible peak of inflation. Incidentally, the
S&P 500 index NYSEARCA: SPY hit a low of $362.17 the same month. Coincidence? Maybe Not.
What Does CPI Measure
The CPI is generally a measure of the cost of living for an average person. It includes pricing trends for thousands of items through nearly 23,000 retail and service businesses and 43,000 rental housing units throughout 75 urban areas in the country. It collects approximately 90,000 prices in eight categories from housing, apparel, transportation, education and communication, recreation, medical care, food and beverages, and goods and services. There is overall CPI and core CPI.
Core CPI
The financial markets pay most attention to the core CPI, which excludes food (14% of overall CPI) and energy prices (7.5%) due to their volatility skewing the results. The core CPI is used to measure the core inflation, which also excludes food and energy prices. Core CPI is like adjusted earnings, as many critics argue that food and energy prices actually impact households the hardest. For example, the December 2021 core CPI was 7% excluding energy and food. However, energy and food absolutely hit consumer wallets hard. Within the energy category, gasoline prices rose 50.8%. Within the food category, beef roasts rose 22.1%. The information is all included in the BLS overall CPI data also referred to as CPI-U. It just requires a little digging. The Federal Reserve also references core CPI or core inflation in policy announcements and is widely considered the benchmark to gauge the trend of inflation. It’s also used as a cost of living indicator to adjust the wages for workers, Social Security, and Medicare payments. It can be used to gauge the yield curve and recessions during periods of monetary tightening and expansion.
What the CPI Means for the Stock Market
As illustrated on the chart, the CPI and SPY had positive correlation until April 2021 when the CPI surged to 4.2% from 2.6% prior month. The CPI line (blue) crossed up through the SPY (pink) line. From that point forward, the negative correlation or divergence began. Rising CPI resulted in falling SPY and vice versa. The CPI peaked at 9.1% and the SPY bottomed at $362.17 in June 2022. We can only tell if the peak lasts in hindsight. As the July CPI came in lower at 8.5%, the SPY started its rally off the bottom. The big question is if the CPI will continue to fall, which means the interest rate hikes are finally kicking in, and the SPY will continue to rise. The SPY would rise in anticipation of the Federal Reserve slowing down the magnitude and the pace of interest rate hikes, which is bullish for the markets. In a nutshell, CPI rises, then interest rates rise, and SPY falls. If CPI falls, then interest rates fall, and SPY rises. It will take at least two or more months of continued CPI decline for markets to maintain a foothold on the rise as a single month pullback has been a false indicator for the past two years.
Before you consider SPDR S&P 500 ETF Trust, you'll want to hear this.
MarketBeat keeps track of Wall Street's top-rated and best performing research analysts and the stocks they recommend to their clients on a daily basis. MarketBeat has identified the five stocks that top analysts are quietly whispering to their clients to buy now before the broader market catches on... and SPDR S&P 500 ETF Trust wasn't on the list.
While SPDR S&P 500 ETF Trust currently has a Hold rating among analysts, top-rated analysts believe these five stocks are better buys.
View The Five Stocks Here
Looking to profit from the electric vehicle mega-trend? Click the link to see our list of which EV stocks show the most long-term potential.
Get This Free Report
Like this article? Share it with a colleague.
Link copied to clipboard.