A Lot Deeper, But Don’t Worry About It
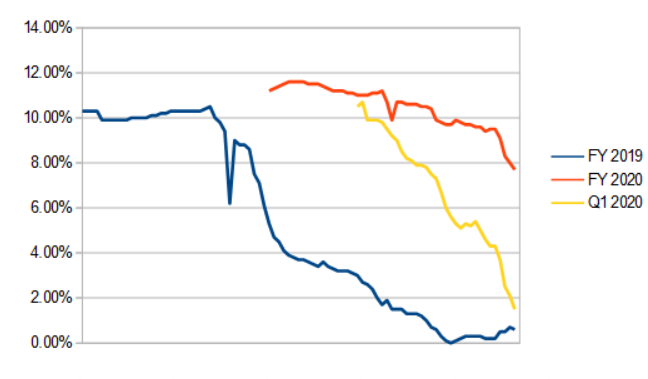
The coronavirus sparked a massive sell-off in the broad equities market. The coronavirus is the catalyst that set the sell-off in motion but it is not the underlying cause, the broad equities market has been ripe for correction for well over a year. The market’s foundation, the substance upon which stocks are valued, is earnings growth and earnings growth is shaky. All the virus did was make market participants realize the fact and that sparked a massive revaluation of secular proportions.
What am I talking about with earnings and shaky foundations? Think about this. The consensus outlook for S&P 500 (SPY) EPS growth in 2019 was double-digits at the beginning of the calendar year. By the end of the year’s reporting cycle that growth will be closer to 0.5%. The outlook for 2020 EPS growth was also double-digits at the start of the calendar year and has been declining ever since. Add in the coronavirus and that growth could easily fall to 0% this year. In that case, the last two years of the market rally are based on nothing.
Before I move on I would like to take a look at the S&P 500 over the past 30 years. I want to do this because today’s market correction needs perspective. Without that perspective, you’ll think I’m crazy when I say this market could correct 20% or more, and I am very happy about it.
We Are In A Secular Bull Market
The S&P 500 is in a secular bull market that is driven by demographics. It is well understood that the Baby Boomers were the largest generation in American history until the Millennials. Between them are Generation X, a much smaller demographic cohort, and the generation to which I myself belong.
The demographic make-up of our population created the secular bear market of the 2000’s. The secular bear market was induced because there were more Baby Boomers than Gen Xers. When the Boomers began to turn 55 in 1999 they began to reposition their assets out of risk and into safety. Coincidentally, that generational shift occurred simultaneously to the Tech Bubble and the bubble burst. There just weren’t enough Gen Xers to support the market. That scenario played out again in 2008 when the Housing Bubble burst, there weren't enough Gen Xers to support all that house-flipping activity.
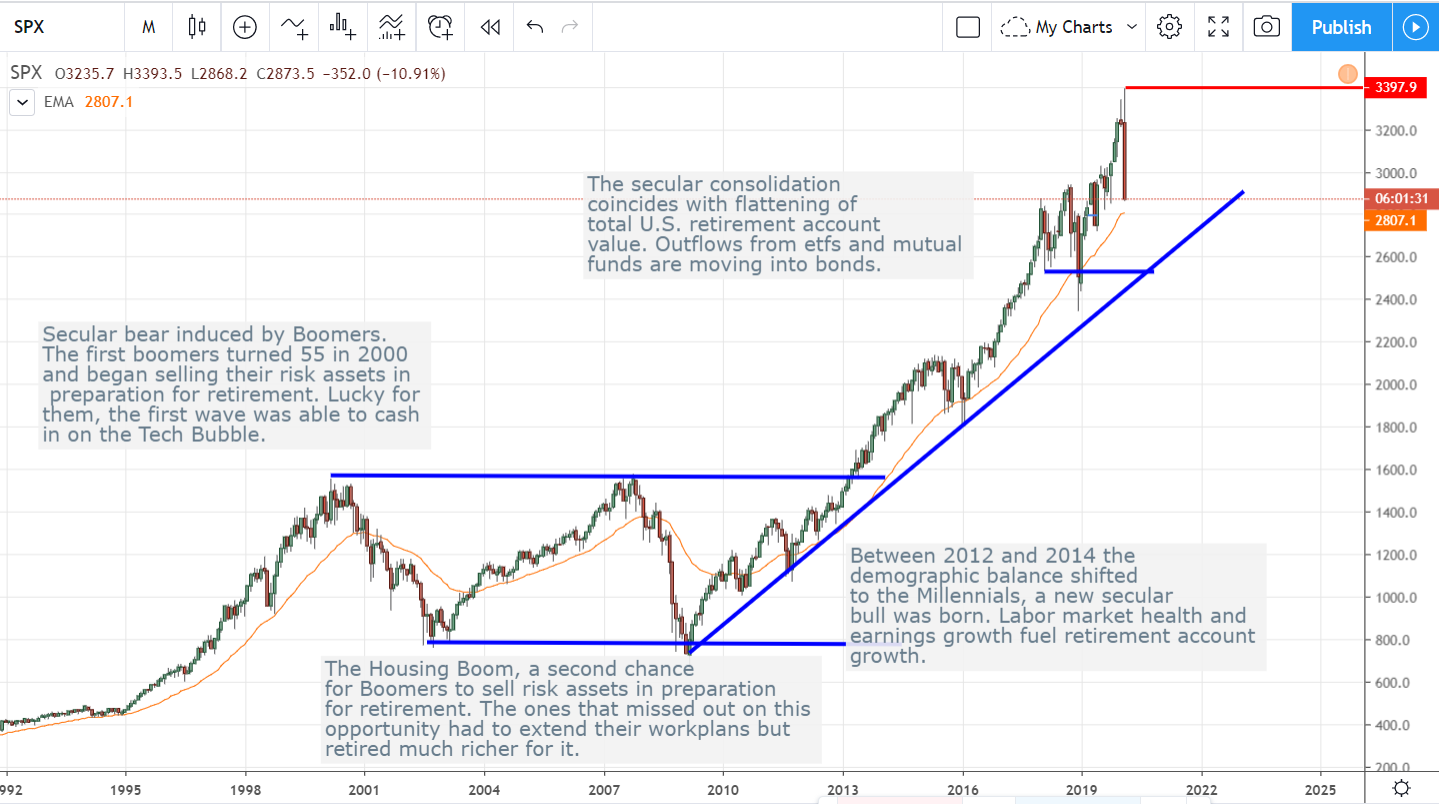
Fast forward to 2012 and the demographic tides begin to turn. The Baby Boomer generation has begun to retire en masse and the Millennials are entering the workforce. This shift drove economic growth, is underpinning the current labor market and helped drive the S&P 500 up off of the bottom of the secular range. As the shift gained momentum it pushed the S&P 500 up to retest secular resistance, and then broke the market out to new highs. The Secular Bull Market was born.
We Are Also In A Secular Consolidation
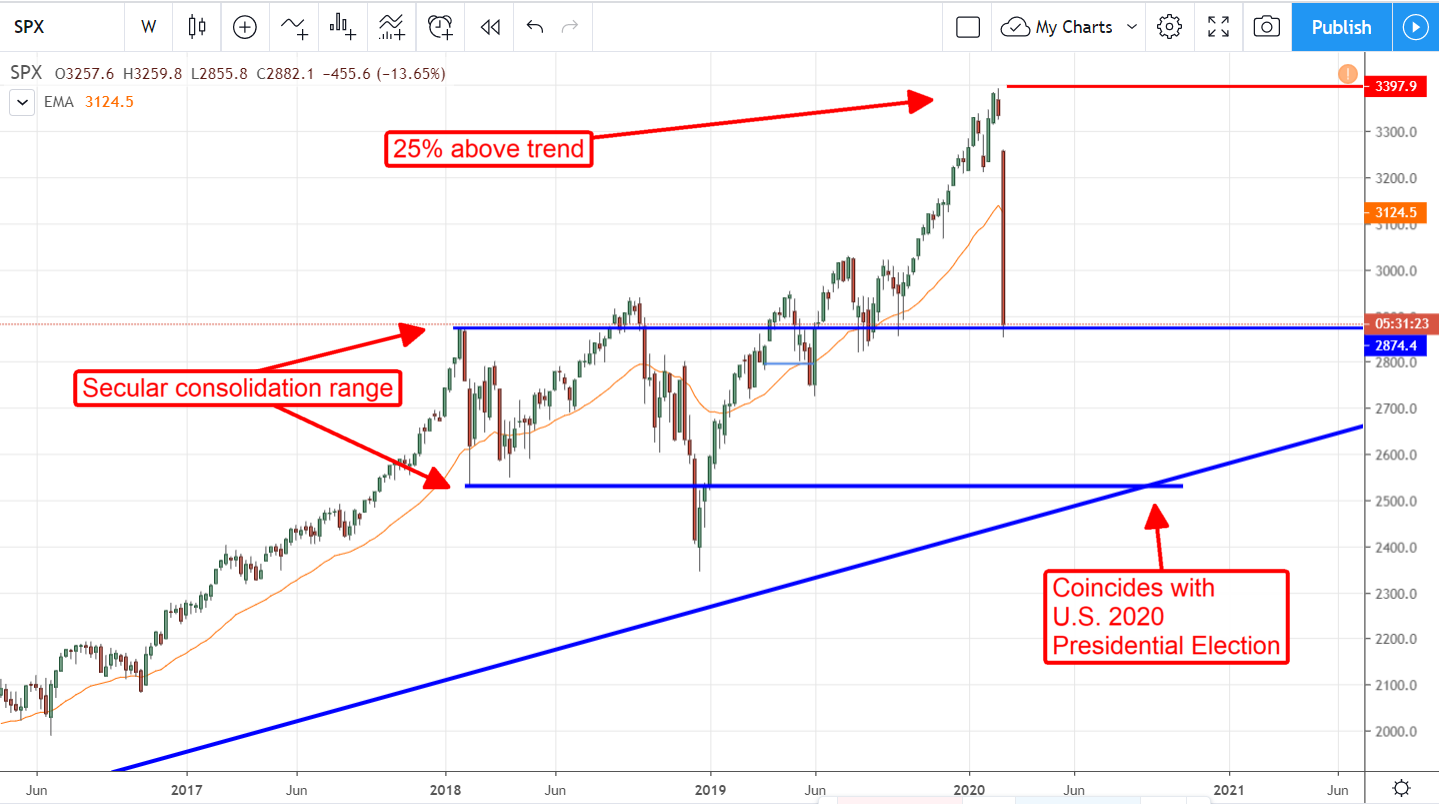
The S&P is in a secular uptrend but that uptrend has been in consolidation for the last two years. This consolidation is plain to see on the monthly chart, what is also plain to see is the market is elevated well above the secular trend line and the bottom of the consolidation range. At the high, the S&P 500 was a little more than 25% above the trend line and trading at a historically high valuation, just over 19X forward earnings, a good time in any technicians book to start taking profits.
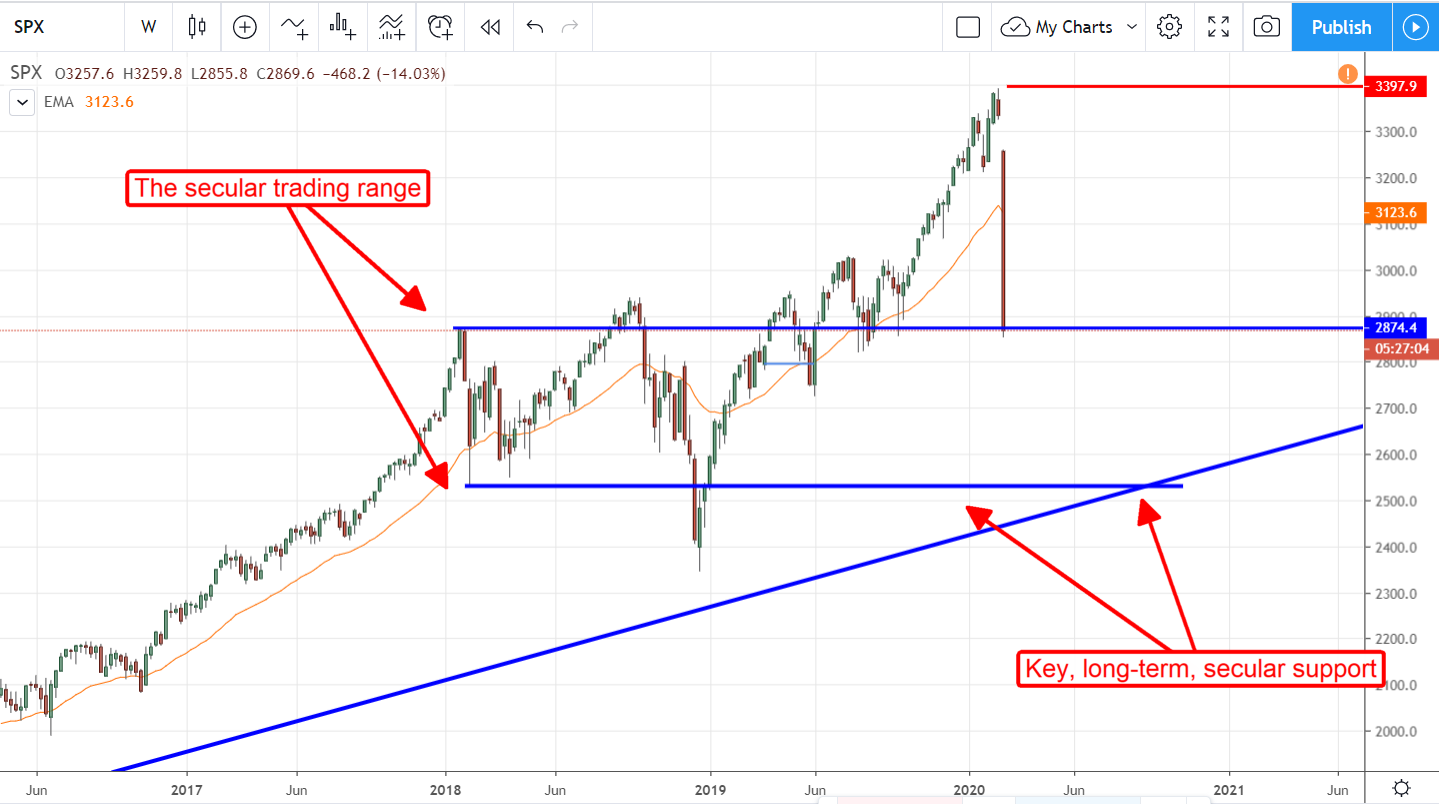
Now let’s move down to the weekly charts for a better view of the consolidation I have been talking about. The consolidation began in early 2018 when Trump fired the first shots in the trade war. Support was found and the market bounced back to new highs by mid-year. The silly market thought the trade war might be over, but it wasn’t. The market fell again and reconfirmed resistance at the top of what had become a secular trading range.
The second test of support, in late 2018, got as deep as it did because investors were waiting for the buying to start, no one wanted to be first. That bounce led to the 2019 rally which, as mentioned, coincided with rapidly declining EPS growth outlook. I myself though the top of the range would confirm again when it was reached in mid-2019. The push to new highs, in my opinion, is inexplicable other than by calling it a trade-deal inspired whipsaw driven entirely by hope. And now it’s correcting.
So, How Low Can This Market Go?
How low can the market go? A lot lower I think. Today’s action has the S&P 500 testing support at the top of the secular consolidation range and right now it’s trading below it. If this level doesn’t provide support as it should (previous resistance can turn to support after a breakout) a full retracement of the 2019 rally is the most likely outcome. That could be as much as 25% and more is possible.
The reason I am happy about this selloff is that it is going to set up a buying opportunity of generational proportions. I expect to see the market move down to secular support and bounce. It may take the index the rest of the year to get its legs back under it but the secular bull market is not over. A secular bull market could last 20+ years and I think that is a good guesstimate for this one.
Assuming the 2009 bottom as the start of this secular bull market that leaves another 9 years to go. The 9-year target also coincides with the next big demographic shift, it'll be that long until the Millennial generation is at full-employment. The virus will pass, sooner or later, and when it does the world economy will perk back up.
Not coincidentally, my support line at 2537 and the uptrend line, both key secular support levels, intersect right about the time of the U.S. election. With that in mind, I think the political atmosphere has no small part in the sell-off. I will not be surprised to see the market bob along support during the middle portion of this year and then bounce when support and trend line intersect. Until then, I am focusing my own investing on dividend payers with little to no exposure to international revenue.
Before you make your next trade, you'll want to hear this.
MarketBeat keeps track of Wall Street's top-rated and best performing research analysts and the stocks they recommend to their clients on a daily basis.
Our team has identified the five stocks that top analysts are quietly whispering to their clients to buy now before the broader market catches on... and none of the big name stocks were on the list.
They believe these five stocks are the five best companies for investors to buy now...
See The Five Stocks Here
The AI wave will soon hit public markets with Anthropic and OpenAI set to go public later this year. However, you don't have to wait to invest. This report shows seven AI stocks that you can buy today while the big model providers get ready to go public.
Get This Free Report
Like this article? Share it with a colleague.
Link copied to clipboard.