Electric vehicle and energy storage systems manufacturer
Tesla Inc (NASDAQ: TSLA) has been making daily headlines stemming from the extreme volatility of its underlying shares. CEO Elon Musk has been locked in a perpetual war with critics and short-sellers. On Jan. 28, 2020, Tesla detonated the equivalent of a nuclear bomb with its
Q4 2019 earnings release handily beating estimates by $1.52-per share and guiding FY 2020 deliveries above 500,000 vehicles. This kicked off a +50-point gap the following morning to 633 from prior close at 580.99. As anxious short-sellers attempted to fade the gap, the bulls were raising price targets with some reaching as high as $6,000-per share. This incredibly optimistic narrative triggered massive short-covering both voluntary and forced liquidation from margin calls as TSLA shares exploded in three days to peak at 968.99 on Feb. 4, 2020, before rug pulling to a low of 687 two days later. Shares recovered back above the 767 level with a daily make-or-break set-up. Where do shares go from here?
The $2 Billion Line in the Sand
On Feb. 13, 2020, Tesla announced plans to raise $2 billion in a secondary stock offering priced at $767-per share. The news initially caused a gap down hitting lows of 735, but quickly recovered. CEO Elon Musk stated his participation in the secondary with the purchase of $10 million shares followed by Tesla board members and co-founder of Oracle Corp. NASDAQ: ORCL Larry Ellison purchasing $1 million of the offering. The offering contradicts comments made two weeks of not needing to pursue a capital raise. Markets accepted that funds were being used to finance growth and improve the balance sheet. The real significance of this capital raise is the $767 offering price serving as “line in the sand” technical support.
Narrative Impacts Sentiment
Despite (futile) attempts to rationalize stock price action either for the bull or bear case, the simple reality is that price action is anchored to sentiment. Investor sentiment drives price action. The sentiment is dynamic, and perpetual but most importantly determined by how the narrative is shaped. This narrative can change daily from headlines, rumors and most commonly price action (which often precedes headlines). This is how stocks hitting new highs can continue to grind higher and higher. It’s the compounding catalyst that drives momentum stocks. It also explains why momentum stocks plunge so hard when material negative news crushes sentiment.
TSLA Longer-Term Chart Trajectories
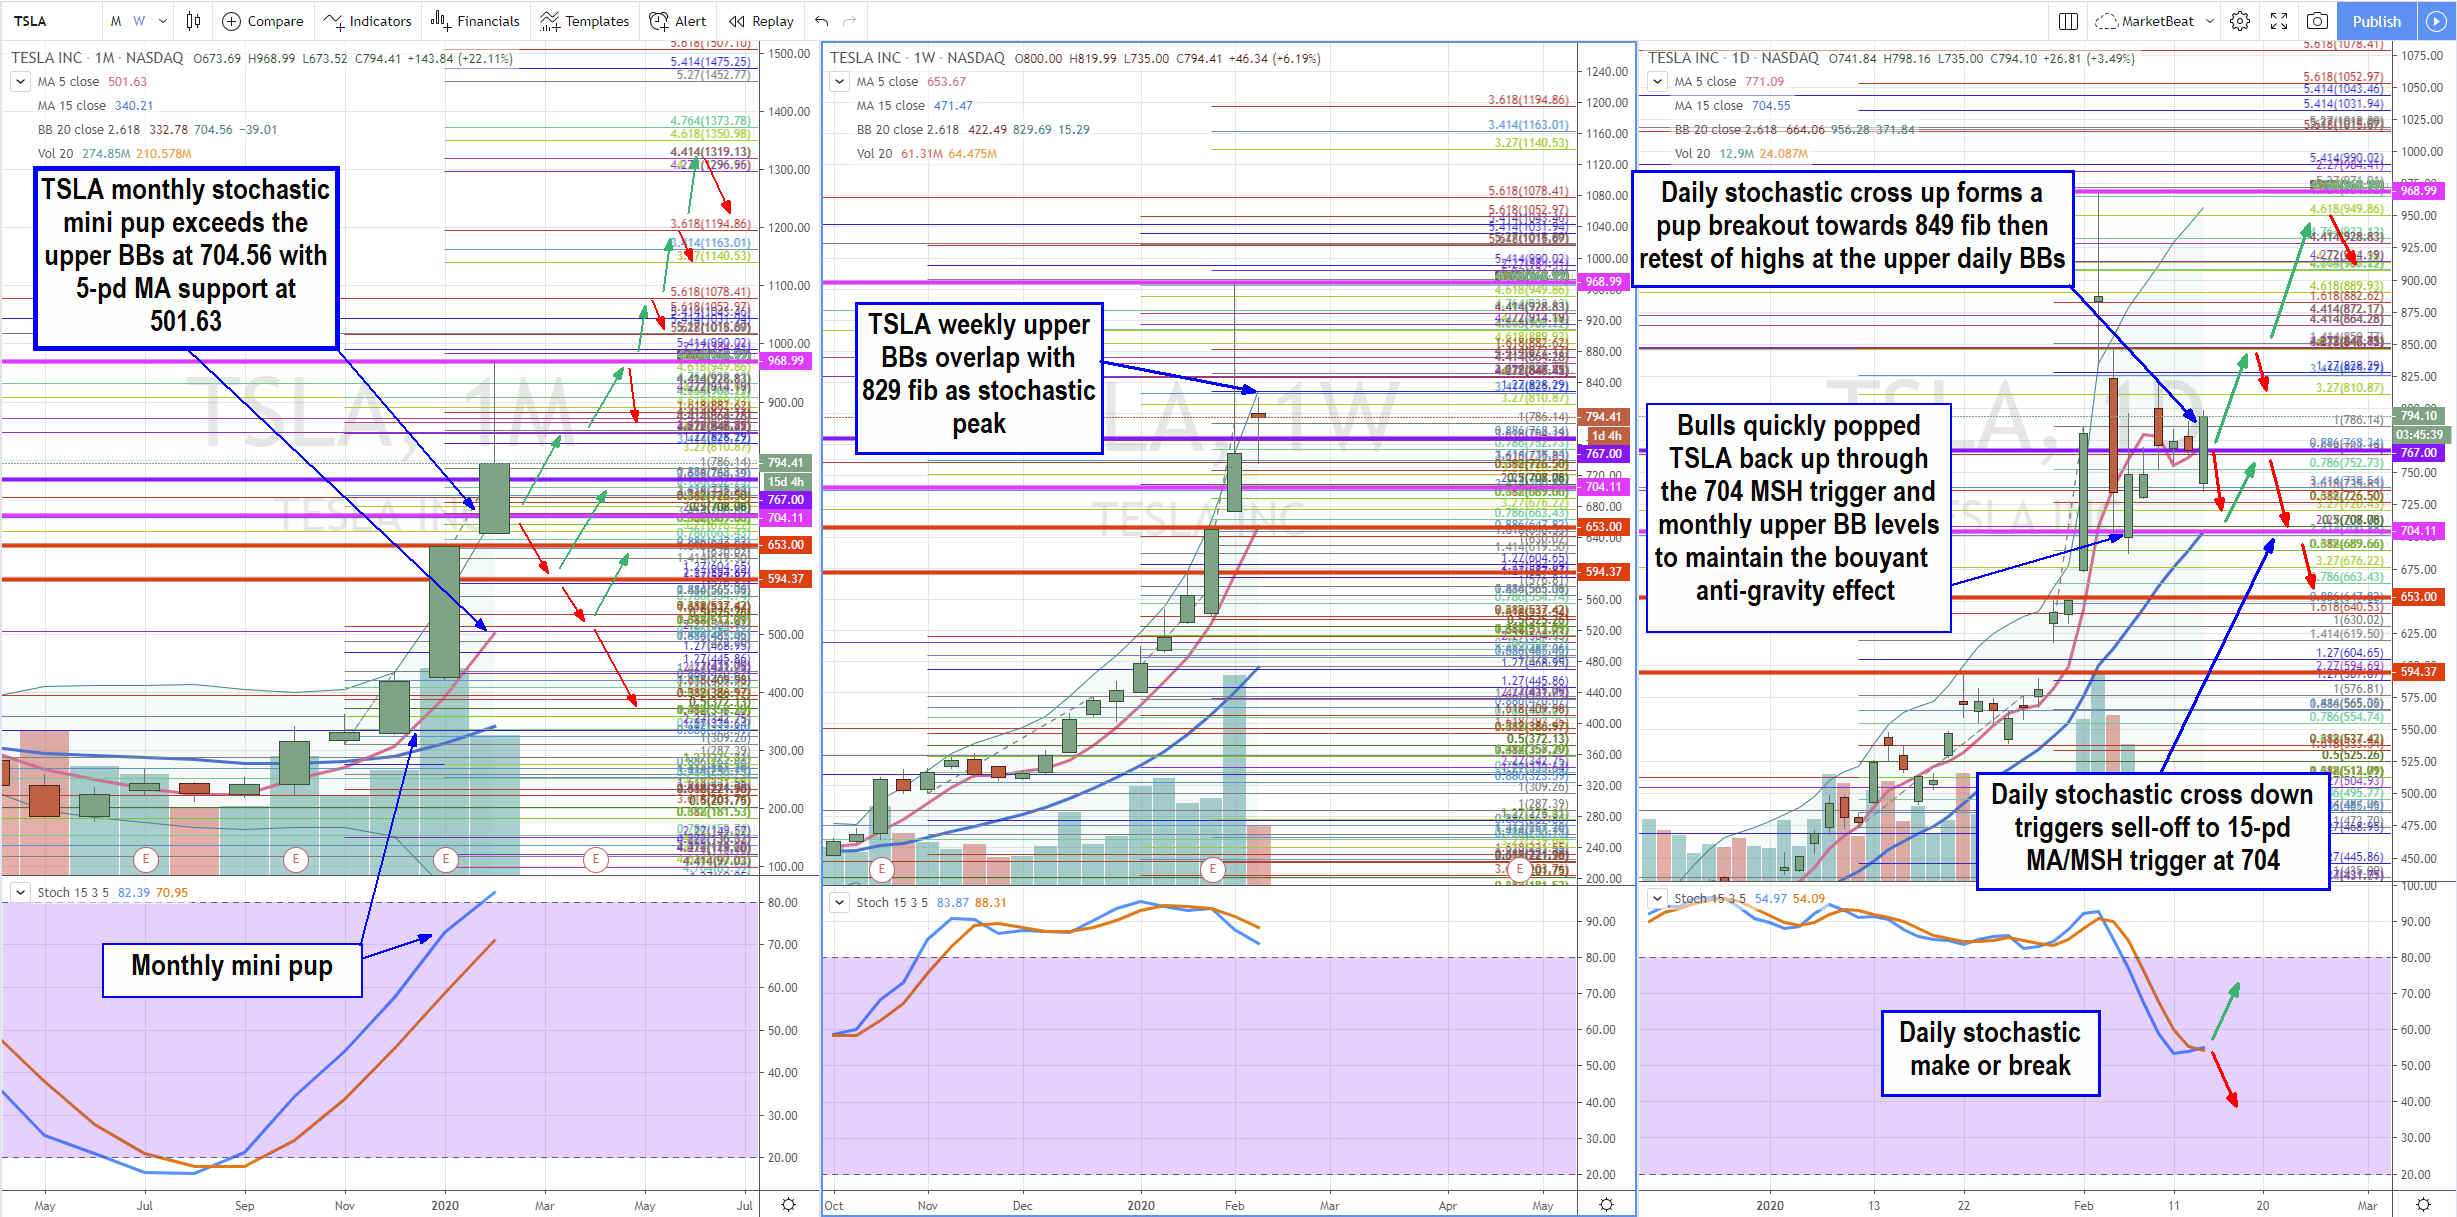
Utilizing the rifle charts on wider time frames in conjunction with key Fibonacci (fib) levels, we can map out the proverbial playing field and derive key price inflection points and trajectories. There are 5 key price levels highlighted on all the charts. The 968.99 is the market structure high (MSH). The 767 is the secondary stock offering price announced on Feb. 13, 2020. The 704.11 is the combination of the daily MSH sell trigger combined with the monthly upper Bollinger Bands. The 663 and 594.37 are gap-fill price levels. The monthly stochastic has been in a bullish stochastic mini pup that squeezed right through its upper Bollinger Bands at 704.56 to peak at 968.99. The 5-period moving average (MA) support sits at 501.63. Both BBs and MAs are rising. The important factor will be how the February monthly candle closes. A monthly candle close under the 704 would trigger a shooting star and MSH heading into March. However, the MSH trigger wouldn’t be determined until the low of the March monthly candle assuming a new high isn’t made. If the low gets taken out in April, then the nominal tightening selloff targets the monthly 5-period MA. Keep in mind the values for the BBs and both 5 and 15-period MAs are dynamic. Each of the five levels will deflect initial tests and reverse or pierce and grind. The 704 monthly upper BBs and daily MSH trigger level is a critical levels for bulls to defend. Upper BBs act like the earth’s atmosphere. When prices spike through upper BBs, gravity vanishes, and prices can float higher. However, when prices fall back under the Upper BBs, gravity takes over to plunge shares back down usually to the 5-period MA. WhenTSLA slipped under 704 briefly after peaking at highs, bulls bum-rushed shares right back up through 704, to maintain the buoyancy of having no gravity above the monthly upper BBs. The upside trajectories on a breakout through the 968.99 highs are the 1,079.41 fib, 1194.86 fib, 1319.13 fib and ultimately 1507 fib. Expect reversions off each 0.618 fib level.
TSLA Short-Term Chart Trajectories
The daily chart has a make or break situation that will be determined by the direction of the stochastic cross. If the daily stochastic crosses up, then a bullish pup breakout forms to push prices to the weekly upper BBs/super fibs at 828 to 850 area before another reversion. This will lift the daily 5-period MA support and ultimately form a breakout towards the daily upper BB range bear the 949.86 fib and 968.99 highs. If the daily stochastic cross down, then the downside target is the daily 15-pd MA and daily MSH trigger at 704. As mentioned earlier, this is a critical support that will attempt to bounce first, but if it cracks then further selling to the weekly 5-period MA is expects near the 653-level fib support for a bounce back up or further selling to the 594.37 gap fill. TSLA can overshoot up to two-three points so pay attention to the candle closes when playing intraday.
Best Automotive Stocks to Invest In for 2020Before you make your next trade, you'll want to hear this.
MarketBeat keeps track of Wall Street's top-rated and best performing research analysts and the stocks they recommend to their clients on a daily basis.
Our team has identified the five stocks that top analysts are quietly whispering to their clients to buy now before the broader market catches on... and none of the big name stocks were on the list.
They believe these five stocks are the five best companies for investors to buy now...
See The Five Stocks Here
Looking for the next FAANG stock before everyone has heard about it? Click the link to see which stocks MarketBeat analysts think might become the next trillion dollar tech company.
Get This Free Report
Like this article? Share it with a colleague.
Link copied to clipboard.