It’s earnings season in the finance sector, and many banks are reporting earnings for the first time since the Federal Reserve's first interest rate hike since 2023. The hike was unanimous at 12-0, but the next move is anything but certain as we head into Q4.
That uncertainty is weighing on banks as they report Q3 results this week, and on Oct. 13 we got results from Wells Fargo & Co. NYSE: WFC, The Goldman Sachs Group Inc. NYSE: GS, and Citigroup Inc. NYSE: C. Although the rate cut came too late to affect Q3 results, it still forces banks to update their outlooks, and their guidance and projections can offer investors clues. Management at all three banks expressed optimism, but the market’s response to the results told the real story.
Wells Fargo: The Beneficiary in Waiting
Wells Fargo & Company Today
WFC
Wells Fargo & Company
$82.90 +2.00 (+2.47%) As of 01:57 PM Eastern
This is a fair market value price provided by Massive. Learn more. - 52-Week Range
- $72.78
▼
$97.76 - Dividend Yield
- 2.41%
- P/E Ratio
- 11.70
- Price Target
- $98.08
Wells Fargo is the most deposit-focused of the three, and it's expected to benefit most in a rising-rate environment. But investors looking for optimistic guidance probably weren’t thrilled with management’s full-year projections. The company reported its
fiscal Q3 2026 results before the market opened and posted a slight beat on earnings per share (EPS), but revenue missed and rose only 2% year over year (YOY). Net interest income (NII) rose 5% YOY to $12.52 billion, and CFO Mike Santomassimo explicitly cited the rate environment as a net positive for the company heading into Q4.
But despite the positive commentary, management projects $13 billion in NII for Q4 and left its full-year 2026 NII projection unchanged at $50 billion. The Q4 figure would represent 4% sequential growth, but Santomassimo noted that Markets NII is liability-sensitive, which could offset some fee growth in Q4. And while NII growth was strong, net interest margin was flat sequentially at 2.43%.
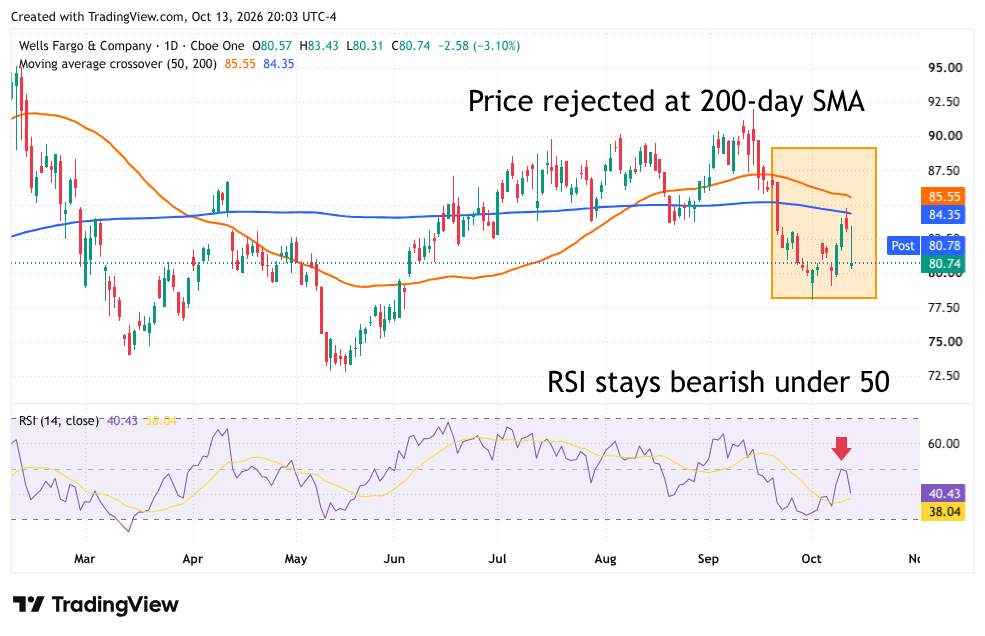
Wells Fargo’s core revenue streams likely make it a winner in a high-rate environment, but the market didn’t respond well to management's “just trust me” guidance heading into Q4. The stock ended the day down 3%, but the price rejection at the 200-day moving average could have a longer impact. With the company saying rate benefits are basically punted into 2027, investors see a shaky road ahead for WFC shares, and the Relative Strength Index (RSI) staying under 50 suggests buyers are starting to thin out.
Goldman Sachs: Dealmaking Squeeze Isn’t Materializing
The Goldman Sachs Group Today
GS
The Goldman Sachs Group
$884.27 +5.55 (+0.63%) As of 01:57 PM Eastern
This is a fair market value price provided by Massive. Learn more. - 52-Week Range
- $740.01
▼
$1,153.99 - Dividend Yield
- 2.26%
- P/E Ratio
- 12.72
- Price Target
- $1,050.55
High rates don’t affect every bank equally. Wells Fargo expects rising rates to be a net positive since it earns more interest from loans. But what about banking activity that high rates hurt, like mergers and acquisitions? A dealmaking slowdown was the biggest concern heading into the Goldman Sachs report, but those fears proved largely unfounded. In
fiscal Q3 2026, the company reported revenue of $18.68 billion, the second-highest figure on record and 23% higher than the same period a year ago. EPS of $17.01 also shattered the consensus expectation of $12.86 and exceeded $18 per share when charitable contributions were excluded. Investment banking fees rose 21% YOY to $3.22 billion, and advisory fees hit a record $1.65 billion.
But the dealmaking engine keeps churning, and this optimism likely helped the stock outperform peers who also reported on Oct. 13. CEO David Solomon noted that Q3 started with dealmaking activity at a five-year high and remains robust despite a late-quarter slowdown that pushed back several high-profile IPOs. The company has announced more than $1.5 trillion in M&A so far in 2026, which is more than $400 billion above the next closest competitor. Rate volatility could still impact dealmaking in future quarters, but today’s deal flow remains strong.
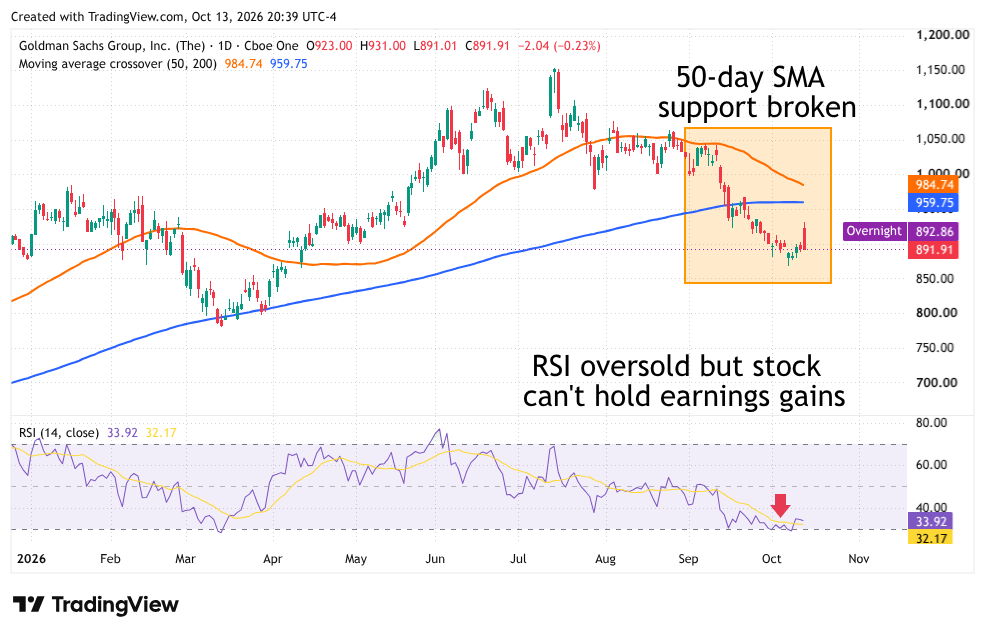
GS shares started the day up nearly 5% before giving back all its gains at then some and closing down 0.17%. This is the best performance of the three, but it's notable given Goldman’s strong earnings relative to the two deposit banks. Despite the RSI hitting extremely oversold levels, the stock's decline below the 50-day and 200-day moving averages dampens short-term momentum, and the market needs more rate clarity before this trend can reverse.
Citigroup: Strong Quarter That the Market Sold Anyway
Citigroup Today
C
Citigroup
$122.73 +0.46 (+0.38%) As of 01:57 PM Eastern
This is a fair market value price provided by Massive. Learn more. - 52-Week Range
- $95.00
▼
$147.96 - Dividend Yield
- 2.18%
- P/E Ratio
- 11.97
- Price Target
- $150.79
Citigroup could be considered the hedge between Wells Fargo and Goldman Sachs. The bank should benefit from higher rates through NII growth, but trading fees should also grow with market indices near all-time highs. In
fiscal Q3 2026, both engines appear to be working. Citigroup reported its highest Q3 revenue in more than a decade at $23.85 billion, up 8% YOY. NII ex-Markets grew 7% YOY to $13.71 billion, while Markets grew 6% and Investment Banking grew 9%. Management also raised its full-year 2026 NII ex-Markets guidance to mid-to-high 6%, up from the 5% to 6% range it projected earlier in the year.
Citigroup raised NII projections while Wells Fargo left them flat. So why did Citigroup’s stock get punished more that day? The answer lies further in the guidance. CFO Gonzalo Luchetti expects Q4 Markets revenue to decline 20%, “or possibly more,” from Q3, and U.S. Consumer Card revenue was flat during the period. Luchetti says the guidance could be conservative, but the market disliked the news, and the stock fell sharply during the day, closing down more than 5.5%.
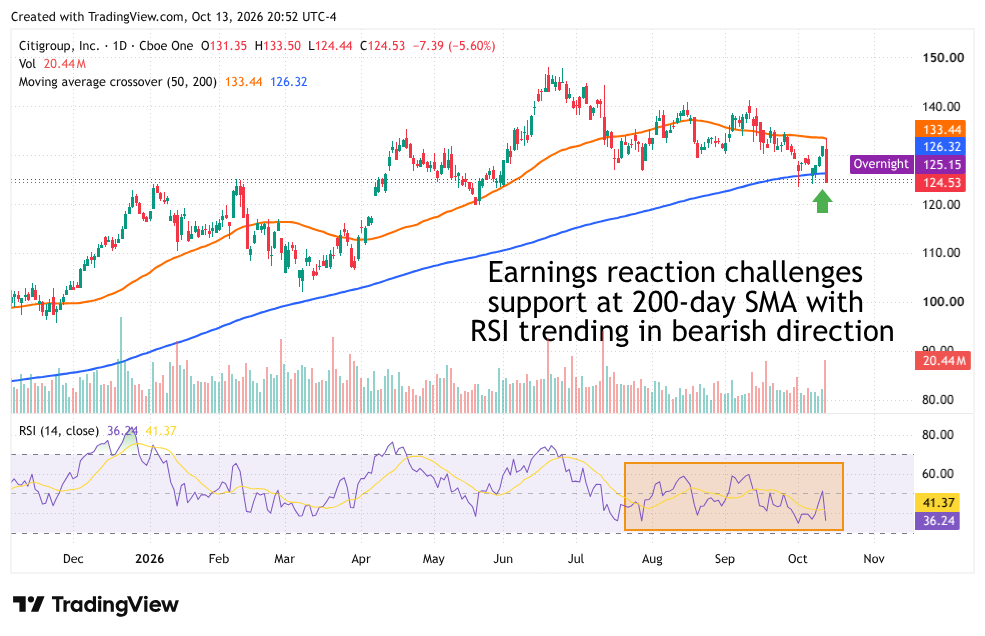
Despite the poor earnings reaction, C stock still has the most promising chart. The stock closed right at the 200-day moving average, keeping the long-term trend pointing in the right direction for now. However, the RSI is trending down, and investors are likely pricing in a quiet Q4 ahead of the next rate move.
Before you consider The Goldman Sachs Group, you'll want to hear this.
MarketBeat keeps track of Wall Street's top-rated and best performing research analysts and the stocks they recommend to their clients on a daily basis. MarketBeat has identified the five stocks that top analysts are quietly whispering to their clients to buy now before the broader market catches on... and The Goldman Sachs Group wasn't on the list.
While The Goldman Sachs Group currently has a Hold rating among analysts, top-rated analysts believe these five stocks are better buys.
View The Five Stocks Here
Tesla, Nvidia, and Google helped shape the last era of market growth, but the next wave could come from a new group of companies. Inside this report, you’ll find 7 stocks that could play a major role in the next tech-driven market boom.
Get This Free Report
Continue following MarketBeat
Add MarketBeat as your preferred source on Google to see our latest stories in your feed.
Like this article? Share it with a colleague.
Link copied to clipboard.
