Costco Wholesale Today
COST
Costco Wholesale
$990.31 +12.30 (+1.26%) As of 01:42 PM Eastern
This is a fair market value price provided by Massive. Learn more. - 52-Week Range
- $844.06
▼
$1,096.50 - Dividend Yield
- 0.59%
- P/E Ratio
- 47.74
- Price Target
- $1,087.40
Despite soaring gas prices, high rates, and weak consumer sentiment, Americans continue to spend. While recent retail earnings have been mixed, reports from major banks have highlighted resilient consumer strength across both high- and low-income cohorts. Yes, consumers feel pinched by high prices (
and slowing wage growth).
Still, spending continues, and cost-conscious consumers are the perfect clientele for warehouse-club retailers like Costco Wholesale Corp. NASDAQ: COST. COST stock hasn’t hit a new all-time high in nearly five months, but the fundamentals are accelerating just as the stock tests the 200-day moving average. Is Costco’s lackluster year finally about to pick up?
Costco September Sales Snap 3 Months of Decline
Costco hit the market with a double blast of encouraging news in the last few weeks. First, the company reported its fiscal Q4 2026 results on Sept. 24, beating expectations on both the top and bottom lines with 6.7% year-over-year (YOY) comparable-sales growth after adjusting for currency and fuel. Earnings beat expectations even after removing 15 cents per share for one-time tariff refunds, and revenue of $95.72 billion beat expectations by more than $750 million. Membership metrics were also strong, with paid Executive members reaching 42.3 million and U.S./Canada renewal rates at 92.3%, up 10 basis points from fiscal Q3.
On Oct. 7, Costco reported its September sales brief, covering the five weeks ending Oct. 4. Adjusted comparable sales grew 7.6% YOY, the fastest pace since May’s 8% increase at the height of the Hormuz crisis. August adjusted comps came in at just 5.4%, so September marked a notable acceleration, even after removing 50 basis points for Labor Day tailwinds.
Canada was the lone sour spot with 4.9% adjusted comps, but Other International adjusted comps grew 7.7%. Gas is doing much of the heavy lifting in reported sales, with gasoline comps rising more than 30%. However, the adjusted figures exclude the effects of gasoline price changes and currency fluctuations, offering a clearer picture of underlying growth. Gas also drives foot traffic, and CFO Gary Millerchip said members who pump gas also visit stores more often.
Continued Sales Growth Could Reverse Analyst Price Target Trimming
Costco Wholesale MarketRank™ Stock Analysis
4.418086500655 of 5 stars- Overall MarketRank™
- 88th Percentile
- Analyst Rating
- Moderate Buy
- Upside/Downside
- 10.4% Upside
- Short Interest Level
- Healthy
- Dividend Strength
- Strong
- News Sentiment
- 1.01

- Insider Trading
- Selling Shares
- Proj. Earnings Growth
- 9.78%
See Full AnalysisDespite the double fiscal Q4 earnings beat on Sept. 24, analysts were in no hurry to raise their price targets. In fact, several firms lowered their price targets the day after the conference call, and Costco bear Bill Kirk at Roth Capital reiterated his
Sell rating and $781 price target. Overall, MarketBeat tracks
32 analysts covering COST shares, with 23 Buys, eight Holds, and one Sell from Roth. The average price target is $1081.79, representing roughly 10% upside from recent trading levels.
Those price-target cuts came before Costco released its stronger September sales figures. A retailer trading at roughly 47 times earnings with slowing revenue growth is hard to keep boosting, even with solid revenue growth, so many analysts kept their rating at Buy while lowering their price targets. But now that September comps are above 7% again, the latest data suggest sales growth is accelerating, and elevated gas prices should continue to drive new memberships and more foot traffic. Analysts may wait for October sales data to confirm or deny the growth trend, but it wouldn’t be surprising to see some price-target reversals over the next few weeks if the stock continues to rally.
Daily Chart Shows COST Shares Approaching Key Technical Levels
COST shares dipped below $900 in late September, the first time they fell below this key level since the first week of 2026. The stock is still up more than 13% year-to-date, but the drawdown since the May all-time high of approximately $1,095 was nearly 20% from peak to trough. After serving as strong support for the first half of the year, the 50-day moving average flipped to resistance during the decline, and the stock struggled to break above it until early October. But COST shares are now back above the 50-day and 200-day moving averages for the first time since May, and other technical signals are starting to turn positive.
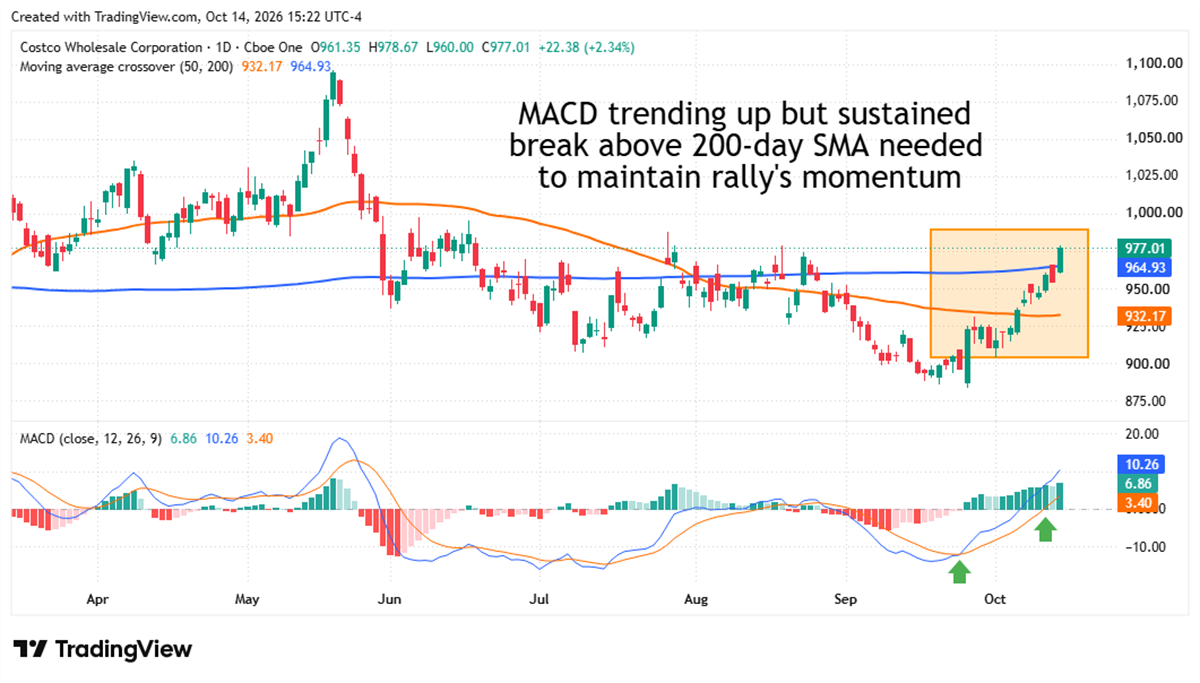
The moving average convergence divergence (MACD) also shows an uptick in buying momentum, and the reversal began with a bullish MACD cross in late September. Now both the MACD and signal lines have crossed over the histogram, a common bullish signal that often triggers a broader rally. The stock is up more than 6% in the last month, which may not sound like a raucous rally, but it pushed the price over $980 for the first time in four months. Technical and fundamental signals are beginning to align, but we may still need one more month of sales data before we can say the COST rally is back in action.
Before you consider Costco Wholesale, you'll want to hear this.
MarketBeat keeps track of Wall Street's top-rated and best performing research analysts and the stocks they recommend to their clients on a daily basis. MarketBeat has identified the five stocks that top analysts are quietly whispering to their clients to buy now before the broader market catches on... and Costco Wholesale wasn't on the list.
While Costco Wholesale currently has a Moderate Buy rating among analysts, top-rated analysts believe these five stocks are better buys.
View The Five Stocks Here
Discover the next wave of investment opportunities with our report, 7 Stocks That Will Be Magnificent in 2026. Explore companies poised to replicate the growth, innovation, and value creation of the tech giants dominating today's markets.
Get This Free Report
Continue following MarketBeat
Add MarketBeat as your preferred source on Google to see our latest stories in your feed.
Like this article? Share it with a colleague.
Link copied to clipboard.
