While you can do your fundamental research to surmise a value to the stock and technical analysis to get a more in-depth price action analysis, it can take some time to perform.
Have you ever wanted an immediate reading of where the stock is trading in its range and whether it was in a trend or consolidating? If so, Bollinger Bands may be the chart indicator for your needs.
They can provide lots of information with just a glance. This article will thoroughly explain Bollinger Bands and what they tell investors and traders. By the end of the article, you'll learn how to use them effectively to gain insights into a stock's price and enable you to make more informed decisions for your trades.
What Are Bollinger Bands?
John Bollinger created Bollinger Bands in 1983.
Bollinger on Bollinger Bands emphatically states that Bollinger Bands are not in and of themselves a buy or a sell signal.
Bollinger Bands are chart indicators typically found on most charting platforms and tools. They are price indicators that help traders and investors visualize a stock's volatility and trading price range.
They work on all stocks, from blue chips to penny stocks. Bollinger Bands are also a popular tool for forex traders. Beginners will need Bollinger Bands explained. They comprise three lines called "bands" or "envelopes."
The upper envelope tends to be in the upper price range for the stock. The middle envelope is a moving average in the middle of the range and often used as a trendline. The lower envelope is the lower price range for the stock. Many traders who use their moving averages tend to stick to just the upper and lower envelopes.
When a stock is at the upper Bollinger Bands, its price is considered relatively high. When a stock is trading at the lower Bollinger Bands, its price is considered relatively low. Often, it can be a news item or material fundamental development that causes stocks to make quick moves that test the Bollinger Bands.
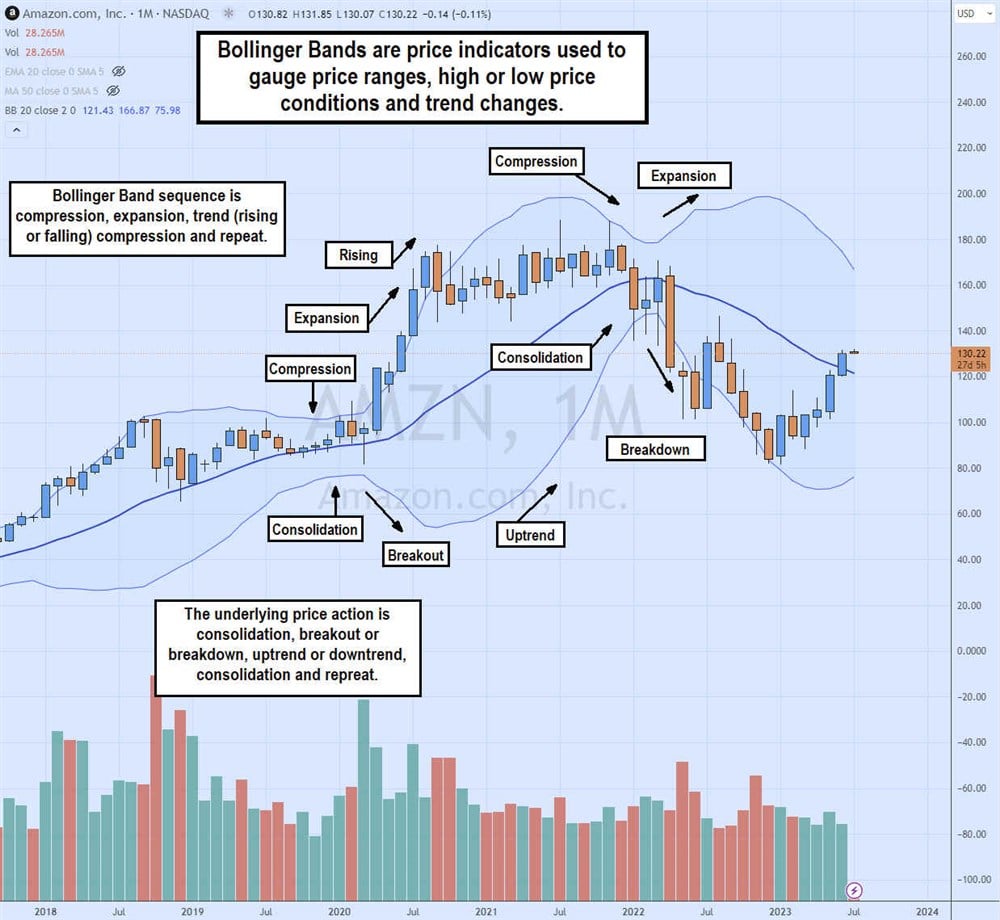
Bollinger Bands can also act as a trend indicator. Like an EKG, Bollinger Bands tend to expand and compress. Expanding Bollinger Bands have the upper envelope rising while the lower envelope falls, expanding the distance between the upper and lower bands.
Compression has the upper envelope falling and the lower envelope rising as the distance between the two tightens. When trading ranges get tighter, the Bollinger Bands compress during consolidations. When a breakout or a breakdown occurs, then the Bollinger will expand. When an extended trend emerges, the Bollinger Bands will follow each other. This means an uptrend will have the upper envelope rising while the lower envelope rises.
Eventually, a compression will form as the stock loses momentum. The Bollinger Bands will expand again, indicating another breakout or breakdown. This is a stock's price lifecycle, breaking in one direction, trending and consolidating before another breakout or breakdown. Here's the four-stage sequence for Bollinger Bands:
- First, the compression, where the stock consolidates as the trading range tightens.
- The second stage is an expansion which results from a breakout or breakdown.
- The third stage is the trend as Bollinger Bands rise or fall together.
- The fourth stage is a reversion back to compression as the stock takes a rest and consolidates ahead of another breakout or breakdown. Rinse and repeat.
Normal Distribution
Bollinger Bands operate on the assumption of a normal distribution or bell curve. A normal distribution is 68% of all price actions fall inside one standard deviation, and 95% fall within two standard deviations. Three standard deviations are where 99.7% of all price actions occur.
This means most of the price action, about 95%, should be contained within the upper and lower envelopes when using two standard deviations. When a stock is trading above its upper envelope or below its lower envelope, it represents strong momentum at high or low prices that will eventually fall back into the Bollinger Band ranges.
Standard Deviation
Standard deviation calculates the width of the Bollinger Bands between the upper and lower envelope. It's a measurement of the dispersion of a dataset relative to the mean. With a default standard deviation of 2, it assumes that 95% of a stock's price moves should be contained within the Bollinger Bands, under the upper envelope and above the lower envelope. Of course, the envelopes are not static. They also compress and expand. When a stock is trading above its upper envelope or below its lower envelope, it means the price is exceptionally high or low, respectively.
It will 100% fall back into the Bollinger Band range eventually. Many traders use these reversal signals when they fall back into the range, also called a channel. In some situations, stocks can overshoot through the Bollinger Bands, including reactions to earnings reports, broker upgrades and downgrades.
How to Calculate Bollinger Bands
Here are the calculations for Bollinger Bands. Thanks to modern technology, you don't have to calculate them manually and perpetually. Bollinger Bands are a default indicator on most charts. The default settings for Bollinger Bands are a 20-period moving average as the middle band and a 2.0 standard deviation, represented by the upper and lower envelope.
The Bollinger Band calculations are based on the middle band moving average (MA). The middle band is a moving average based on a rolling past 20 days divided by 20.
The upper Bollinger Band is calculated by adding the moving average cost with the standard deviation. The formula would look like MA + (2 standard deviation x 20 periods).
The lower Bollinger Band is calculated by subtracting the standard deviation from the moving average. The formula looks like MA – (2 standard deviation x 20 periods).
What Can You Learn from Bollinger Bands?
You can learn many things from Bollinger Bands. The upper and lower envelopes contain the trading range of the stock. When stocks exceed either envelope, it indicates a strong momentum trend and the potential for a reversal when the stock falls back into the trading channel below the upper envelope or above the lower envelope.
When both Bollinger Bands move in the same direction, it indicates a strong trend with follow-through. The longer the Bollinger Bands stay in any of the four stages, the greater the potential for a deeper pullback.
Example of Using Bollinger Bands
Let's use the Bollinger Bands to analyze Alphabet Inc. NASDAQ: GOOGL stock on the daily chart.
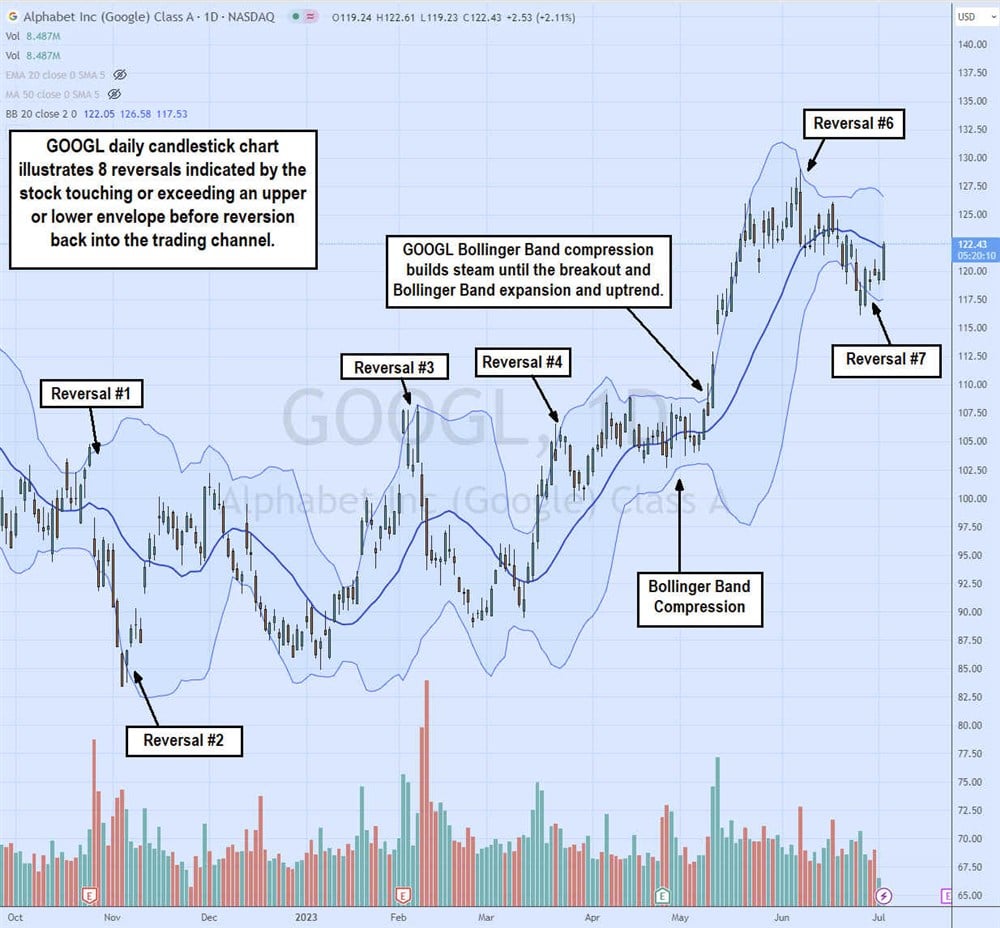
The daily candlestick chart on GOOGL contains the Bollinger Bands consisting of the upper envelope, middle band and lower envelope.
By observing the Bollinger Bands, we can spot the reversals when the stock touches or exceeds a Bollinger Band and reverts into the channel. The GOOGL chart shows eight reversals formed after an upper or lower envelope was touched or overshot.
For example, Reversal 2 shows how GOOGL collapsed under the lower Bollinger band on Nov. 3, 2022, hitting a low of $83.34 when the lower envelope was at $86.61. As shares bounced back up and into the channel the next day, GOOGL staged a rally back over $100 in the next seven days. On Reversal 3, GOOGL tested the daily upper Bollinger Band at $108.08 on Feb. 7, 2023, before reversing the following day. The momentum shifted as selling decreased shares to a low of $88.58 on Feb. 24, 2023.
GOOGL had a powerful breakout after a May 23, 2023, consolidation period. Preceding the breakout, GOOGL had a Bollinger Band compression. Then the breakout caused the Bollinger Band expansion causing shares to explode through the $109 resistance and continue to trend to a high of $126.43 by May 22, 2023, before a short-lived reversion formed. Eventually, GOOGL would bounce and top out at $129.04 on June 7, 2023, before Reversal 7 formed as the Bollinger Bands compressed and expanded on the breakdown to $116.10 by June 27, 2023.
Limitations of Bollinger Bands
While Bollinger Bands sound compelling, you should be well aware of its limitations. Like any indicator, it's not 100%. It also shouldn't be the sole chart indicator you use. Rather, it should be one of your platform's complementary chart indicators. Bollinger Bands don't provide trade signals. They can also be less effective in flat and non-trending markets when trading ranges, and channels are tight on light volume.
Conversely, extremely volatile markets can also render Bollinger Bands less effective. Expanding the standard deviations to a higher number, like 2.618 from 2.0, may be prudent in these situations. Volatile FAANG stocks are good candidates to analyze for Bollinger Bands.
Do Bollinger Bands Work?
Bollinger Bands do work if you are clear about their purpose. Bollinger Bands can alert you to high or low prices. They can also help your plan your trades by catching reversals when matched up with a momentum indicator like the RSI. They can help you identify trends and set potential entry or exit levels. Bollinger Bands work best when combined with additional momentum indicators and price indicators.
Who Should Use Bollinger Bands?
Day traders, swing traders and investors can benefit from using Bollinger Bands. Like all good chart indicators, they are linear through all time frames and all trading stocks. Depending on the trader or investor type, the chart time frame will be the main distinction. Day traders will find shorter time frames like the one-minute, five-minute, 15-minute and/or 60-minute candlestick chart time frames are most suitable. Swing traders and investors would use wider time frames like the 60-minute, daily, weekly and/or monthly.
Developing a Strategy with Bollinger Bands
Combining a price indicator like Bollinger Bands with a momentum indicator like an RSI can provide better insights into the price action. As you get more familiar with Bollinger Bands, you can add enough complementary indicators to develop a Bollinger Band strategy.
We can use our previously analyzed GOOGL daily candlestick chart and add a market structure (MS) trigger and the RSI momentum indicator for a basic Bollinger Band strategy.
Learn how to use the RSI indicator on MarketBeat.
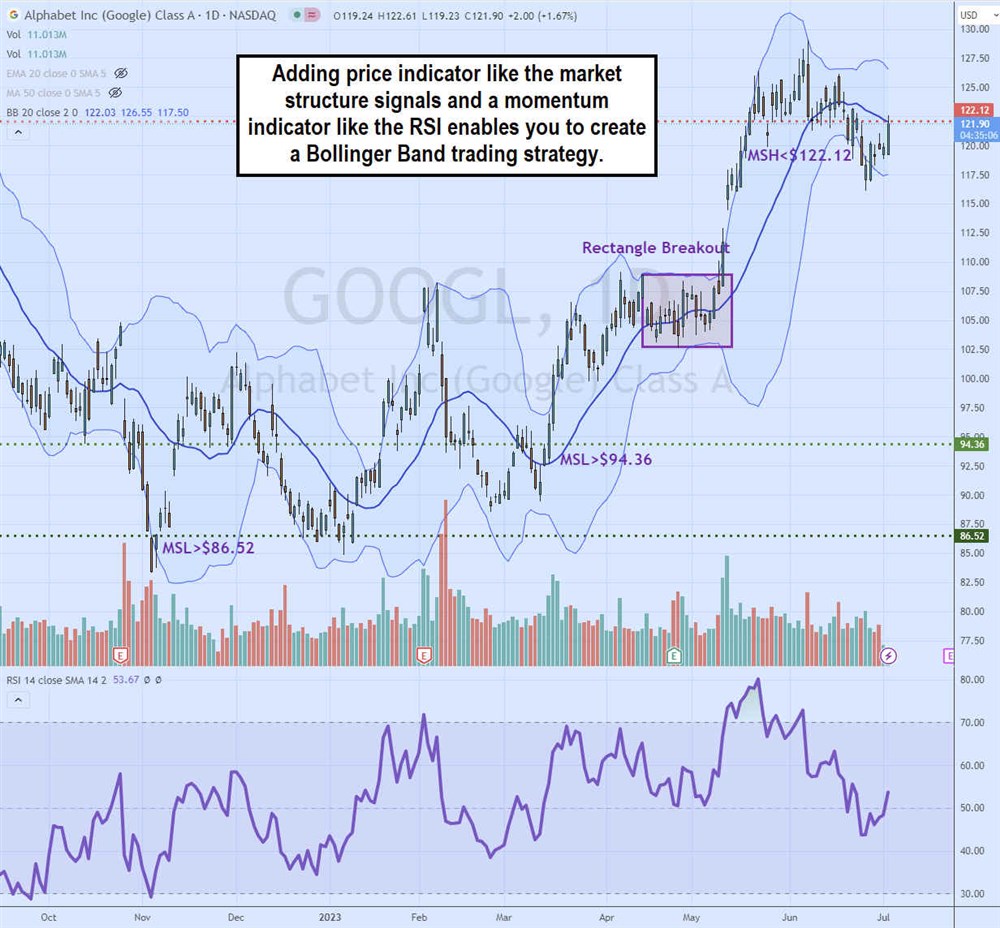
We can use the Bollinger Bands to spot the reversals and the market structure low (MSL) to buy the reversal bounces. MSL is comprised of a low, lower-low and higher-low candlestick. The high price of the higher-low candlestick acts as the buy trigger. The first such buy trigger was the MSL breakout through $86.52. The RSI bounced off the 30-band, indicating a fresh momentum reversal backup. A second MSL buy signal was the breakout through $94.36.
Utilizing a classic rectangle pattern and the Bollinger Band compression, we can spot the breakout through a $109 buy trigger on May 10, 2023. GOOGL continued to rally to a high of $129.04 before a reversion and Bollinger Band compression formed. This preceded the market structure high (MSH) breakdown under $122.13 as the RSI fell back under the overbought 70-band. The Bollinger Bands expanded on the breakdown this time, causing GOOGL shares to hit a low of $116.10 on June 27, 2023.
Watch how to use the RSI indicator on MarketBeat.
FAQs
Here are answers to some frequently asked questions.
What do Bollinger Bands tell traders?
Bollinger Bands tell traders when prices are high or low relative to their trading range. They can also visualize whether a stock's price is in the compression stage, which precedes an expansion stage during trending periods. When combined with a momentum indicator, Bollinger Bands can help traders with buy and sell signals when they develop a Bollinger Band trading strategy.
Are Bollinger Bands a good indicator?
Bollinger Bands can be a good indicator when used with other complementary indicators. Bollinger Bands are a price indicator; adding a momentum indicator can provide a better picture of the price action. Bollinger Bands should be one of many chart indicators you use. Read through the definitive beginner's guide to reading stock charts on MarketBeat. They work best as a part of a trading system or strategy.
What happens when Bollinger Bands meet?
Bollinger Bands compress and expand. They rarely ever meet, as that would imply an extremely tight trading range. Therefore if Bollinger Bands meet, chances are the stock is not active or delisted as there would be no trading channel. Bollinger Bands exist to illustrate the trading channel of a stock.
Before you consider Alphabet, you'll want to hear this.
MarketBeat keeps track of Wall Street's top-rated and best performing research analysts and the stocks they recommend to their clients on a daily basis. MarketBeat has identified the five stocks that top analysts are quietly whispering to their clients to buy now before the broader market catches on... and Alphabet wasn't on the list.
While Alphabet currently has a Moderate Buy rating among analysts, top-rated analysts believe these five stocks are better buys.