In this article, we'll take a deep dive to help you better understand what is a dead cat bounce in stocks. We'll review how to identify them using stock charts and compare them to other patterns so you can add them to your trading arsenal.
What is a dead cat bounce?
A dead cat bounce, a sharp bounce following a steep price drop or a prolonged downtrend, is considered a trailing indicator for traders and investors who practice technical analysis. The term dead cat bounce derives from the belief that even a dead cat can bounce if it falls from a high enough elevation.
All stocks can have a dead cat bounce, including penny stocks, blue chip stocks, dividend stocks and large-cap stocks with long-term holding time frames. No one group of stocks is more or less likely to experience a dead cat bounce.
What is a dead cat bounce, exactly? The first sign in stock market is a sharp bounce after a steep price drop or prolonged downtrend. The sharp bounce gives bulls hope for a recovery.
This bounce can also trigger short sellers to cover their positions and buyers to come off the fence. That's because the bounce gives the impression of a capitulation bottom making a sharp recovery. As the stock pops, buyers may even chase the entries as the fear of missing out (FOMO) drives emotional beliefs that the stock will recover back to its prior high.
However, the bounce tends to stall at an impenetrable resistance level. Buyers see that the resistance is not breaking and start cutting their positions as shares resume selling. The downtrend resumes with a new batch of long positions that can panic out as the positions turn red. This downtrend can also invite new short-sellers, who expect further downside, to jump on the selling momentum.
Eventually, the short-lived bounce fizzles out as each consecutive bounce gets smaller. With stocks, a dead cat bounce eventually resumes the downtrend, often breaking its previous swing low as earlier buyers may turn sellers as their positions turn red.
Indications of a dead cat bounce
Let's review the stages to answer the question, "What is a dead cat bounce in the stock market?". A dead cat bounce consists of three stages.
- The first stage is a sharp or prolonged sell-off in a stock. This often occurs during earnings season as stocks sell off on a company's earnings report and guidance.
- The second stage is a sharp bounce to a resistance price level. This bounce frequently occurs on relatively light volume. It also tends to happen due to a lack of news or catalysts. However, short covering can be a factor in the dead cat bounce. The bounce can often peak near a Fibonacci retracement level as a resistance.
- The third stage is the rejection of the resistance level. This rejection causes the stock to sell off again, back down to and possibly through the recent low.
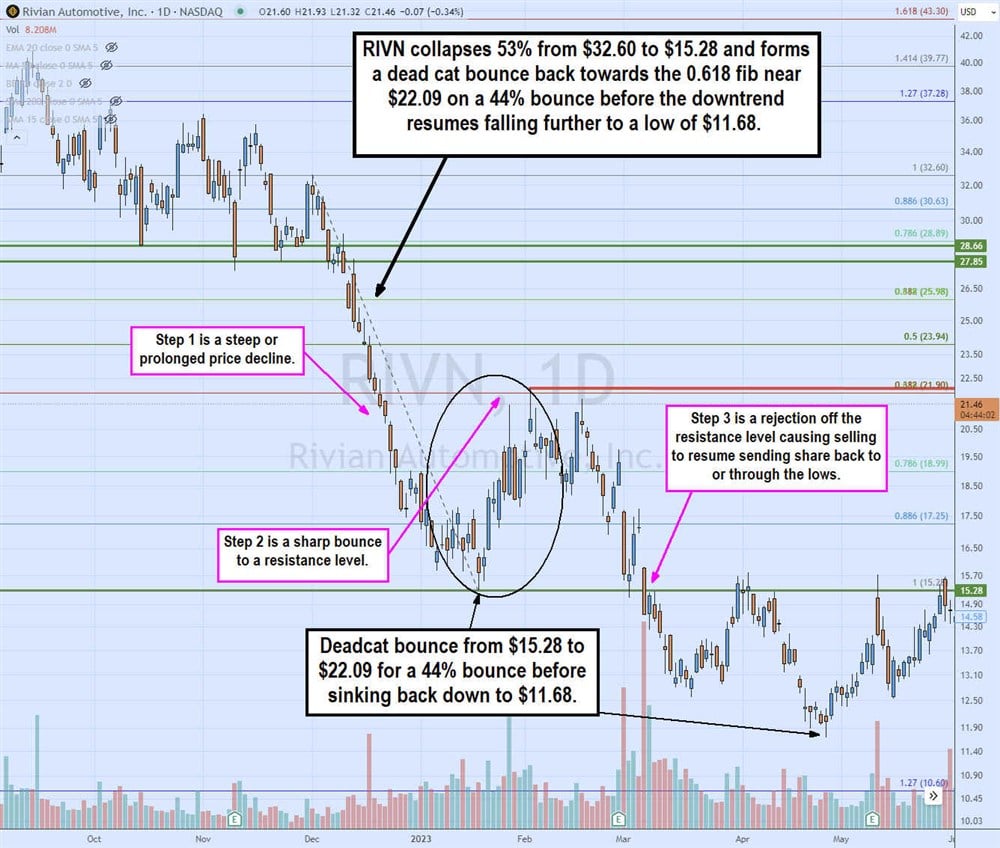
The daily candlestick chart on electric vehicle (EV) manufacturer Rivian Automotive Inc. (NASDAQ: RIVN) illustrates the three steps of a dead cat bounce:
- The first step was the 53% sharp price steep decline from $32.60 to $28.66 to reach the low of $15.29.
- The second step was the 44% bounce from the $15.29 low to the $22.09 peak. It's also near the 0.618 fib retracement level at $21.90. The volume thins out after hitting the peak resistance.
- The third step is the resumption of selling as shares continue the downtrend towards the $15.28 previous swing low. In this case, the selling managed to break through the lows to a new swing low of $11.68.
How long can a dead cat bounce last?
There is no time limit or requirement for the duration of a dead cat bounce. The length of a dead cat bounce is relative to the time frame it's being tracked. Dead cat bounces can occur on charts as short as one minute or as long as monthly candlesticks.
With the different time frames, it's possible to have a dead cat bounce on a shorter time frame within a dead cat bounce on a longer time frame. In the preceding RIVN dead cat bounce chart, the bounce occurred following the $15.28 bottom on January 19, 2023, to a peak of $22.09 on February 2, 2023, lasting 10 days, as indicated by 10 daily candles.
How to spot a dead cat bounce
A dead cat bounce is a trailing indicator because you can only identify it afterward and view it in hindsight. However, specific characteristics help you monitor the conditions setting up for a dead cat bounce. These characteristics occur in the following order:
The price falls steeply, typically between 15-70%. This drop is known as the event decline. In about half the cases, this decline will mark the trend low. However, in other cases, it is only the first leg.
The price will continue to fall the next day. As we noted above, in about half the cases, the initial decline brings the price down to its trend low. However, the rest of the time, the price continues lower the next trading day.
It doesn't end there. Seventeen percent continue the trend into a third day, nine percent into a fourth day, and three percent into a fifth day. The average time between the beginning of an event decline and the price reaching a trend low is seven days. The average decline between the initial price gap and the trend low is 31%.
Once the trend low or swing low is hit, the price will rise. This is the dead cat bounce. From the time of the initial bounce to the peak of the bounce, it may take as long as six months.
This is an important characteristic of dead cat bounces. While the price decline will occur over a relatively short period, the bounce could take significantly longer. This is one reason why it can be challenging to identify a dead cat bounce until after one has occurred.
When the bounce peaks, the price will continue to go back down. During this new plunge, the price may decline approximately 30%, putting an average of 18% below the event low 60% of the time.
There may be a second dead cat bounce. In some cases, about a quarter of the time, there will be a second dead cat bounce within three months that could rise as high as 15%. Nearly 40% will have a second dead cat bounce within six months.
Dead cat bounce vs. other patterns
Dead cat bounces can occur as a part of larger patterns. Remember that the dead cat bounce is a downtrend continuation pattern. This means the selling will resume as the price marks its way back down again after the relatively short-lived bounce. Many patterns take into effect the reversion bounce before resuming the downtrend.
Bear flag
A bear flag is a downtrend continuation pattern marked by a steep downtrend called the flagpole. The dead cat bounce occurs with parallel higher highs and higher lows forming the flag. The breakdown occurs when the stock collapses back down through the lower trendline and the downtrend resumes, causing shares to break down through the event low to new lows.
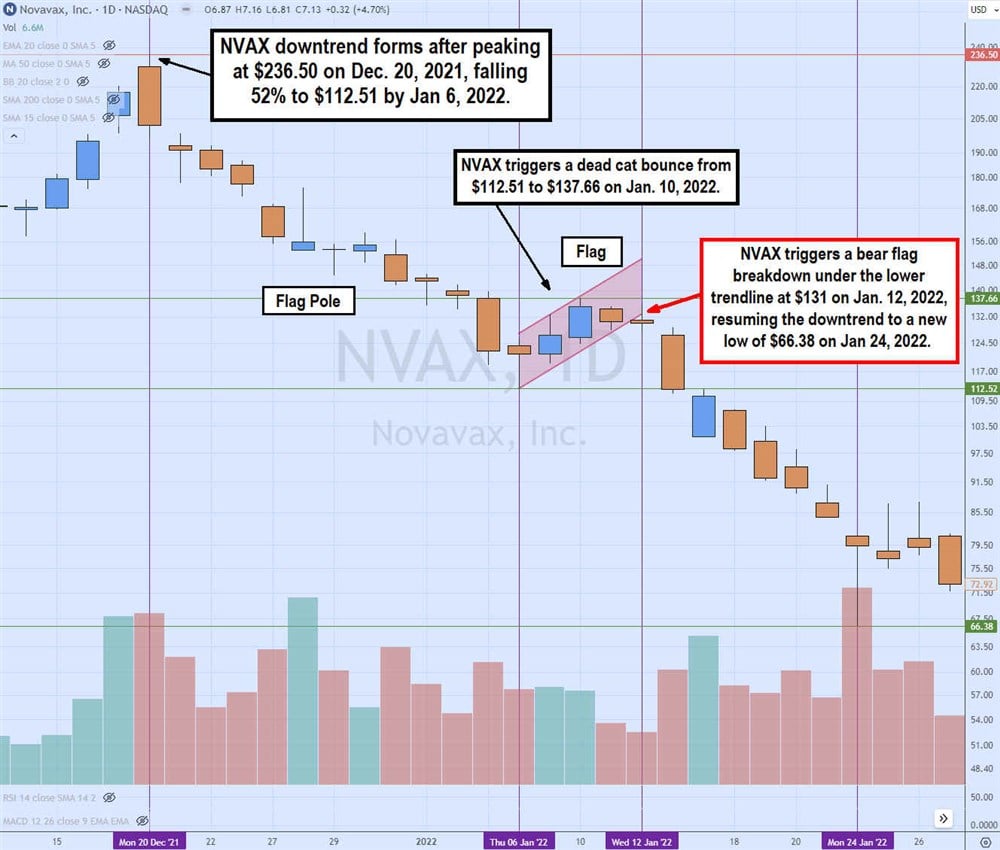 The daily candlestick chart on NVAX illustrates the peak at $236.50 on December 20, 2021, before falling 52%, forming the flag pole to an event low at $112.52 on January 6, 2022. The flag formed on the dead cat bounce by 22.3% to a peak of $137.66 on January 10, 2022. The bounce had parallel higher highs and higher lows, as indicated by the parallel upper and lower diagonal trendlines. The bear flag breakdown occurred on NVAX, which fell under the lower trendline at $131 as it resumed the downtrend to a low of $66.38 on January 24, 2022.
Falling wedge breakdown
A falling wedge is a downtrend continuation pattern that forms after a dead cat bounce. The same steps occur, including the steep price drop, sharp price bounce and reversal to resume the downtrend. The falling wedge comprises higher highs on bounces and higher lows on bounces, similar to the bear flat. However, the higher highs tend to be slower than the higher lows, thereby shaping the upper trendline inward rather than parallel to the lower trendline, as seen in a bear flag. It's a bear flag with an inward-angled upper trendline. The breakdown triggers when shares fall back under the lower trendline.
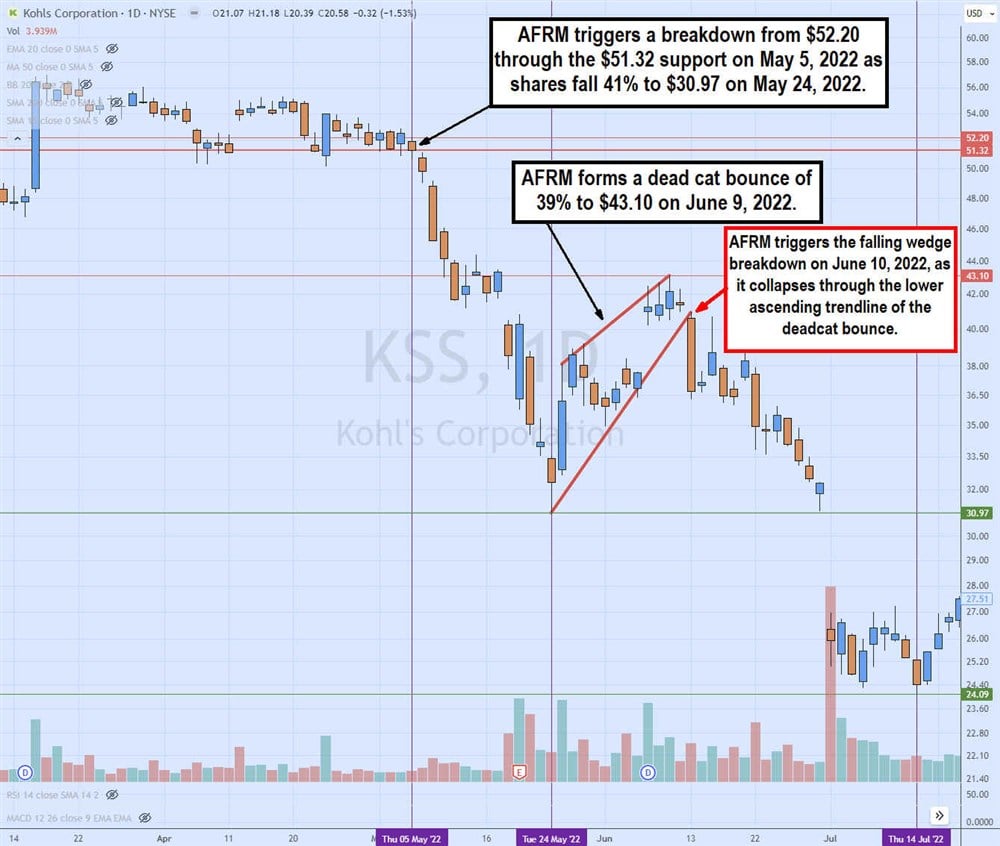
The KSS daily chart shows the breakdown through $51.32 on May 5, 2022, sending shares collapsing 41% to a low of $30.97 on May 24, 2022.
KSS triggers a dead cat bounce, spiking 39% to $43.10 by June 9, 2022. The ascending lower trendline and upper trendline are angled inward, not parallel. On June 13, 2022, KSS triggered a breakdown through the lower ascending trendline at $40.94, which resumed the downtrend back down through the event low at $30.97 to a new event low at $24.09 on July 14, 2022.
Example of a dead cat bounce
Let's look at an example of a dead cat bounce with the daily chart of Affirm Inc. (NASDAQ: AFRM). The chart comprises the three parts of a dead cat bounce: steep drop, sharp dead cat bounce and downtrend resumption.
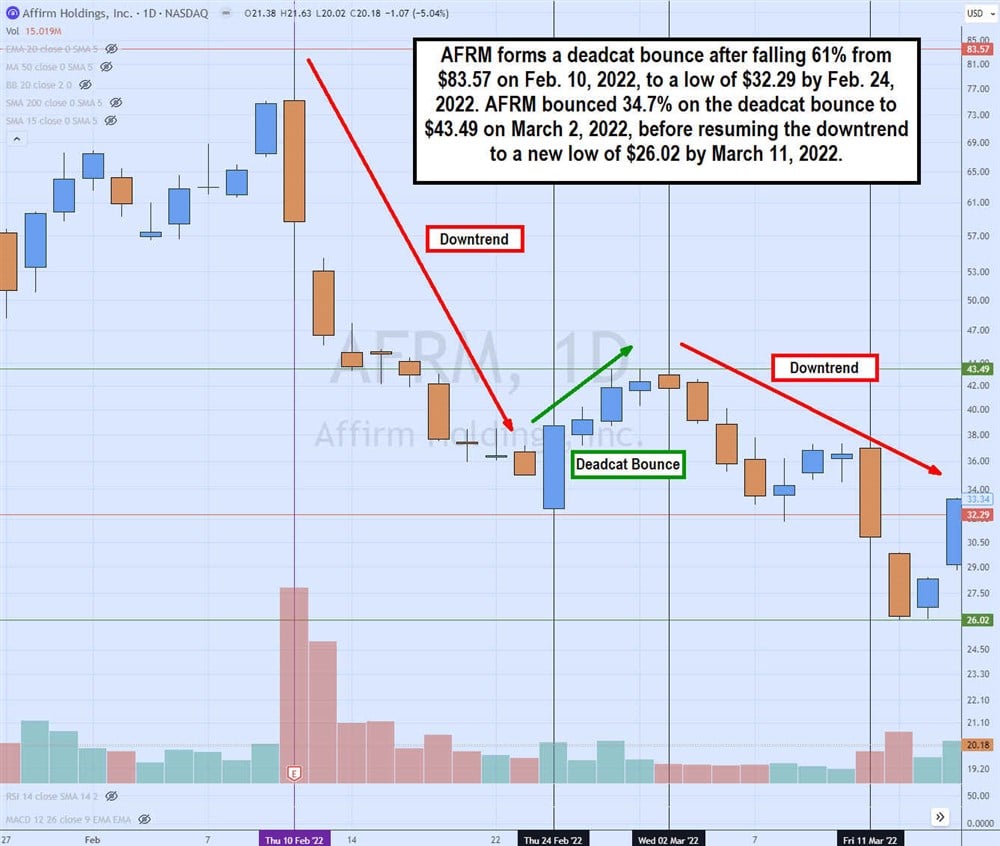
The daily candlestick chart for AFRM peaks at $83.57 on February 10, 2022.
- Step 1, AFRM falls sharply for a steep downtrend, falling 61% for the next 10 trading days.
- Step 2 puts in a bottom at $32.39 on February 24, 2022 and forms the dead cat bounce, rising 34.7% in the following three days to $43.49.
- Step 3 triggers as AFRM reverses back down to test the $32.29 previous low support accompanied by a smaller bounce to $37s before collapsing through the swing low towards a new low of $26.02 on March 14, 2022.
Limitations in identifying a dead cat bounce
There are limitations to identifying a dead cat bounce, and even the best analysts get it wrong. For example, in March 2009, after a prolonged bear market, the renowned economist Nouriel Roubini dismissed the rally as the start of a deadcat bounce stock market. He was wrong, which shows that you must know the rules to confirm what is dead cat bounce and what is not.
You can only identify dead cat bounces after they form. Like looking in the rearview mirror, dead cat bounces are trailing indicators you can only identify after they have bounced and resumed the downtrend. Remember, there are three steps to a dead cat bounce. You can confirm a dead cat bounce until the final step of reversing back down to continue the downtrend.
Determining a true reversal over a dead cat bounce takes time. When the dead cat bounce forms, the second step always appears to be a trend reversal. This reversal attempt can be prolonged or sharp. The bounce is only labeled a dead cat when it breaks down again. However, the breakdown can become a wiggle as it surges higher. Some traders will consider a dead cat bounce to confirm when the stock falls back under its event low to avoid getting chopped.
How and when to trade a dead cat bounce
Despite a dead cat bounce being a lagging or trailing indicator, you can still trade it. We've provided examples of what is a dead cat bounce in trading.
Remember the three stages of a dead cat bounce:
- A sharp or prolonged sell-off
- A sharp bounce to a resistance price level
- Rejection of the resistance level
You can trade each of the three steps of a dead cat bounce. For the initial step of a steep decline, traders can try to short-sell the stock. When the stock makes a bottom and attempts to bounce, traders can try to buy long to capitalize on the bounce. Adding a price indicator like moving averages can help visualize a stock chart's trend.
A price action pattern like a market structure low (MSL) can be combined with a momentum indicator like the relative strength index (RSI), which you can use to time the entry and exits. It's important to have a trailing stop at the lower rising trendline if you hold the position to avoid getting trapped in a breakdown, which confirms the dead cat bounce pattern. For the final step, traders can short-sell the stock either upon breaking the lower ascending trendline or a breakdown through the event low.
It's worth mentioning that short selling should only be considered for well-capitalized and seasoned traders since losses can be much greater than your capital. You can trade each dead cat bounce step with an effective trading system. You can look for dead cat bounce stocks with the MarketBeat stock screener.
Before you make your next trade, you'll want to hear this.
MarketBeat keeps track of Wall Street's top-rated and best performing research analysts and the stocks they recommend to their clients on a daily basis.
They believe these five stocks are the five best companies for investors to buy now...