While there are many price indicators to spot support and resistance levels, there are many times when stocks seem to turn without being in proximity to a moving average or a Bollinger Band.
Like a rogue wave, a stock with strong momentum suddenly and swiftly reverses, making you wonder if news or some catalyst causes this. If you've experienced it (and likely have), you should learn to use Fibonacci retracement levels.
What Are Fibonacci Retracement Levels?
Unlike a dynamic indicator like a moving average that is always crunching numbers to perpetually calculate the moving average based on X closing prices in X time frame, Fibonacci retracement levels do none of that. Fibonacci levels are static.
They apply to all stocks, from penny stocks to blue chips or dividend to growth stocks. This makes them simpler to use but also begs the question, won't the algorithms figure them out if they are static? Ironically, they tend to occur at uncommon price levels.
Fibonacci levels are price ratio levels based on the Fibonacci sequence. These ratios are then applied to a starting and ending point to determine the static Fibonacci retracement levels. They work due to the natural order of things. It sounds superstitious, and it may be. However, it makes more sense once you see evidence of the Fibonacci sequence around you.
Fibonacci retracement levels can be a great addition to your chart indicators. However, it's also important not to have too many price indicators that overwhelm your chart with noise. Fibonacci levels are a price indicator. You can use fib retracement for any tradeable financial instrument, and it is popular among trading many asset classes, including Fibonacci forex. Technical analysts believe the price will move ahead of material news events like earnings beats and misses. Remembering that nothing is 100% right in technical analysis is important. Fibonacci trading is no different. Use them with other chart indicators to derive better insights into our trades.
What is the Fibonacci Sequence?
The Fibonacci sequence is a series of numbers calculated by adding the last two numbers. Each number is the sum of the two preceding numbers starting with 1. Therefore, the Fibonacci Sequence goes like this: 1, 2, 3, 5, 8, 13, 21, 34, 55 and so on, forever. It's not complicated at all. Incidentally, dividing either number into the forward or preceding number will yield either 0.618 or 1.618.
That is called the golden ratio. It's also referred to as the golden mean and the golden proportion. The golden ratio is the key element in applying the Fibonacci sequence.
Mathematician Leonardo Pisano Bigollo introduced the Fibonacci sequence, also referred to as Leonardo Fibonacci, in his 1202 book titled, "Liber Abaci," which means "book of the abacus." He refers to how rabbits breed and multiply by the Fibonacci sequence. You can find this sequence in nature, from the curvature of a snail's shell to the shape of flowers, pinecones, hurricanes and the formation of galaxies.
The golden ratio is a phenomenon found in all parts of life. You can find the Fibonacci sequence as close as your hand. For example, the bones in your hand follow the Fibonacci sequence. You have eight fingers (not including thumbs), five digits on each hand, three bones in each finger, two bones in each thumb and one thumb on each hand. You can even apply it to human emotions. The stock market operates on two key emotions: fear and greed.
How to Find Fibonacci Retracement Levels
Applying Fibonacci retracement levels to charts involves plotting a starting and ending point. Fibonacci ratios are applied to the value between the two points, and the levels are plotted on the chart with horizontal lines. The key ratios are as follows: 1, 0.886, 0.786, 0.618, 0.50, 0.382.
The 1 is the starting point or plot, and the rest are the value ratios between 1 and the ending plot. Some traders like to add the 0.236 or 0.25 fib ratio. It's best to experiment to see which ratios have the most consistent inflection points. Learning to use the fib retracement tool on your charting platform is important to familiarize yourself with how to draw Fibonacci retracement lines.
The golden ratio of 0.618 usually tends to be an inflection point, but the other ratio levels can also be key inflection points. While Fibonacci ratios are reflected in decimals, they can also be reflected in percentages. For example, a 0.618 Fibonacci ratio is the same as a 61.8% retracement.
The basic starting plot can be from a swing high drawing a line to a swing low. Swing highs and lows are the most recent highs and recent lows on a chart. The retracement is the pullback level. Adding a reverse plot from the swing low band up to the swing high adds the benefit of having the inverse levels to paint an overall picture. The 0.618 on the way down will be a 0.382 on the way up and vice versa.
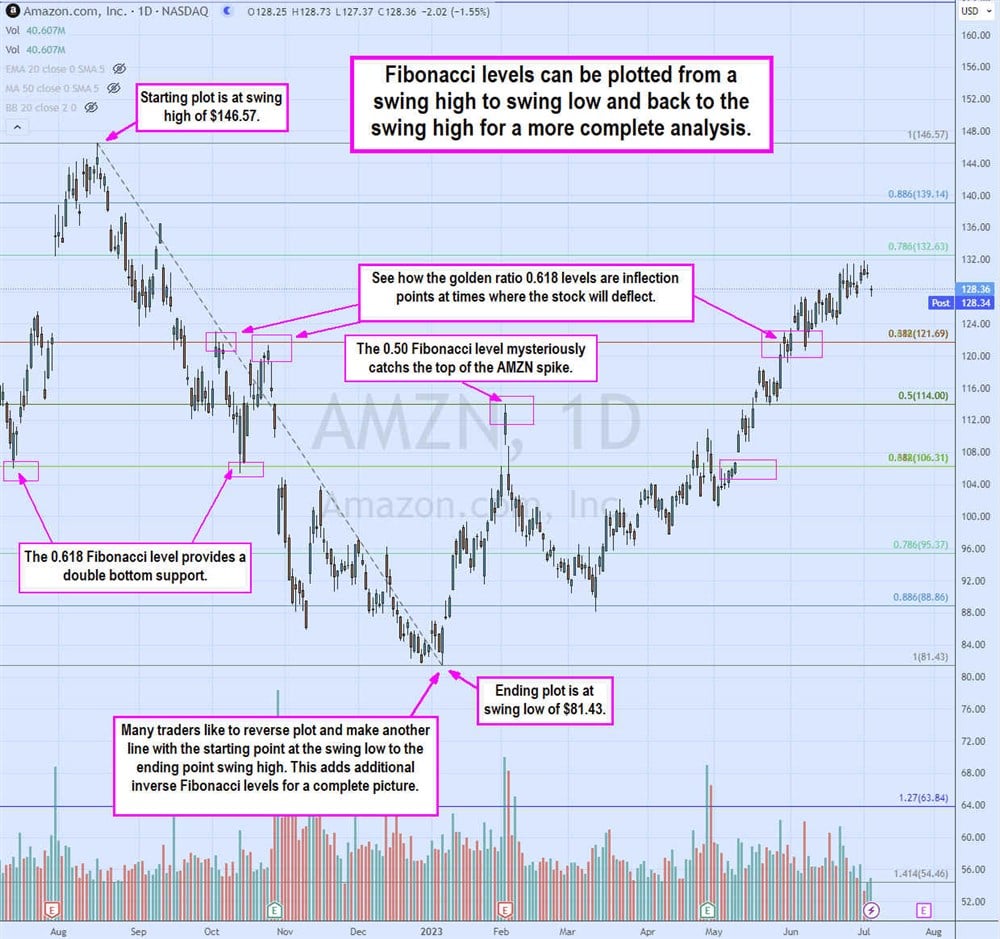
When you plot the Fibonacci levels, you will find some uncanny results. For example, on the AMZN chart, we plotted the starting point high at $146.57 to the swing low at $81.43 and plotted back from the swing low of $81.43 to the swing high of $146.57.
The result is some uncanny price inflection points that mysteriously react as support and resistance levels. The 0.618 levels provide double bottom support at $106.31 in August and October 2022. The 0.50 Fibonacci level was the perfect top when AMZN spiked to $114 in February 2023 and sold off to a low near the 0.886 Fibonacci level in March 2023. You can see how some levels are uncanny in pinpointing nearly exact reversal or breakout levels.
Unlike a momentum indicator like the RSI, Fibonacci levels don’t have a formula. So you understand the significance of the 0.618 Fibonacci retracement level, and the inverse of that is the 0.382 Fibonacci level. You understand how they are derived by dividing the last number into the forward number.
However, where do the 0.50, 0.786 and 0.886 levels come from? The 0.50 is not necessarily a Fibonacci level, but traders commonly use it, and it has become a self-fulfilling prophecy since it can be a significant support and resistance level. The AMZN chart clearly shows that level's significance as resistance after the big spike in February 2023.
The 0.786 is derived from the square root of 0.618. The 0.886 is derived from the square root of 0.786.
What Fibonacci Retracement Levels Indicate
Fibonacci retracement levels indicate price inflection points. Inflection can mean a support or resistance level. Consider it a speed bump. Like any price resistance level, a stock can reject that level, but eventually, if it breaks out through the resistance, it becomes support. This works inverse as well. If a stock breaks down through a support price level, it becomes a resistance level when it bounces.
The AMZN chart shows that the 0.50 Fibonacci level at $114 was nearly the exact resistance into February 2023 as it sold off toward the 0.886 retracement level at $88.86. However, AMZN shares breakout of the 0.50 Fibonacci level at $114 in May 2023, and that level became a support price level that successfully held up against pullbacks as the uptrend continued to the next Fibonacci level of 0.618 at $121.69.
How to Calculate Fibonacci Retracement Levels
Fibonacci retracements derive from the value between two selected points on a chart. Using a simple example, if a stock is $20 and the Fibonacci retracement line is plotted or drawn from the $20 high to the $10 low, then a 0.618 retracement would equate to a ($6.18) pullback. The calculation would be $20 minus $6.18 for $13.82 as the 0.618 Fibonacci retracement level.
How to Trade Using Fibonacci Retracement Levels
Fibonacci retracement levels should be used in conjunction with other complementary indicators. The information derived from Fibonacci levels can help you prepare for price moves if you plan the possible scenarios.
Learning how to use the Fibonacci retracement tool on your charting or brokerage platform is important. It also helps to add a momentum indicator like the relative strength index (RSI). Familiarize yourself with how to draw Fibonacci retracement in uptrend and downtrend. Here are four steps to trading with Fibonacci retracement levels. While Fibonacci retracement levels work on any stock, it can be effective for top-rated stocks with volatility and volume. Let's also use an example of the Intel Co. NASDAQ: INTC weekly candlestick chart. 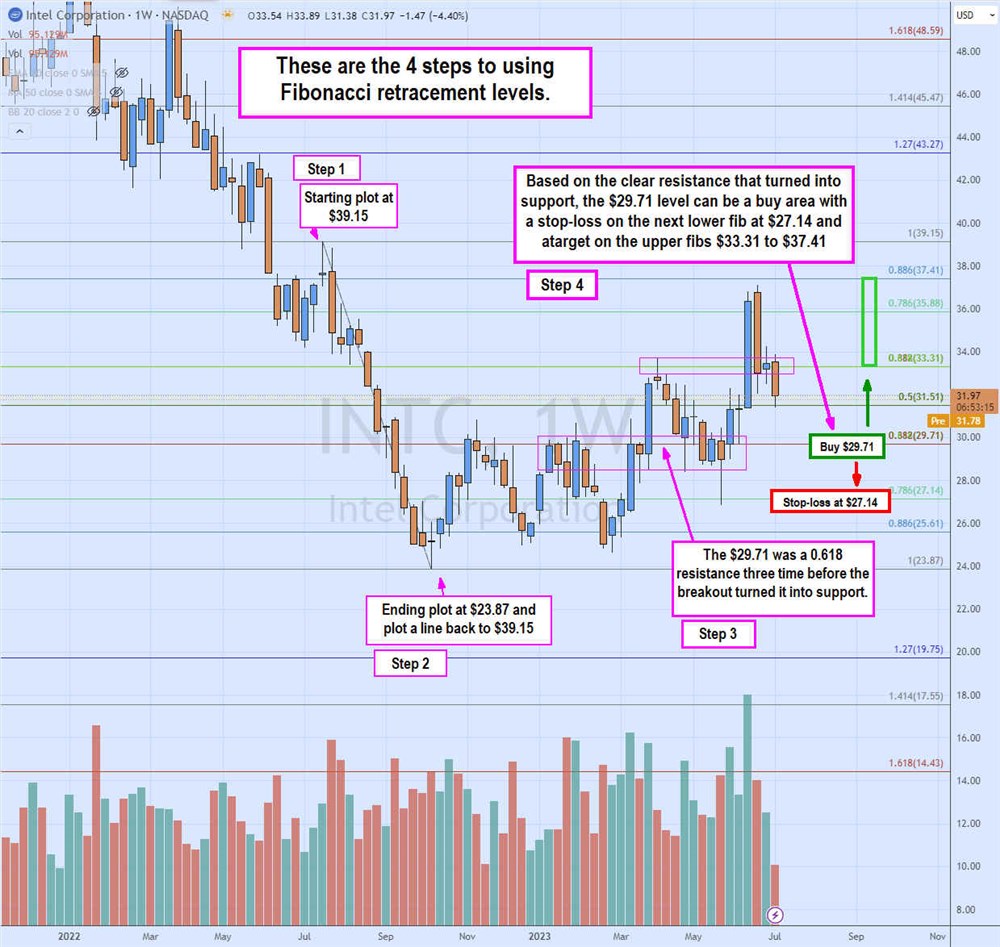
Step 1: Select your Fibonacci start point.
The starting point of your Fibonacci plot is the most significant factor in deriving accurate Fibonacci retracement levels. Select your time frame for the chart. Intraday and swing traders can use hourly, daily, weekly, and monthly charts. Pick a swing high to start the plot. A swing high is the most recent high price. A swing low is a recent low price. There will usually be higher highs and lower lows in the past. When considering a swing high or low, imagine the chart starting from there and moving right, with no data before it. That makes a swing high and low clearer to understand and visualize.
Step 2: Plot your Fibonacci starting and ending points.
Plot the swing high point to a swing low point and plot back to the swing high. In the INTC chart example, we start at the $39.15 swing high to the $23.87 swing low and then back to the $39.15 level. This provides us with a full perspective on Fibonacci retracement levels up and down. You will also notice Fibonacci extension levels at 1.27, 1.414 and 1.618. These provide a good level to watch when the stock exceeds the plot channels. They are useful in situations where a short squeeze may occur.
Step 3: Spot significant Fibonacci price levels.
These are price levels where the stock makes a clear and sharp reversal. While the stock’s wicks may overshoot that level, the body is usually deflected until a strong breakout or breakdown pushes shares through it. With INTC, the $29.71 level is the 0.618 fib retracement level. That level attempted and failed to break out on three separate attempts but finally formed a breakout on its fourth attempt, sending shared to a high just above the opposite 0.618 fib level at $33.31. Shares returned to retest and held support at the $29.71 level before another breakout took it to new highs near the $37.41 Fibonacci level.
Step 4: Use the price inflection levels to plan your trade.
Seeing how the 0.618 Fibonacci retracement level is now supported, that can be a good level to plan to buy on pullbacks. We can also use a trailing stop if it falls under the next fib down, which is the 0.786 level at $27.14. We can look for an upside target to retest the $37.41 level, which is the 0.886 Fibonacci level. Here’s a useful article on how to trade stocks the right way on MarketBeat.
Limitations of Fibonacci Retracement Levels
Like any chart indicator, Fibonacci retracements aren’t perfect. There are limitations to this price tool. The results can be subjective and anchored to where you make your high and low plot points. Using 52-week high and low plot points on a daily chart will render you different results than a five-day swing high and low plot points on a 5-minute chart. They can also be inconsistent with results. As you've seen in the previous chart examples, only some Fibonacci retracement levels will be significant.
The INTC chart shows the significance of the 0.618 Fibonacci retracement level at $29.71 because it rejected breakout attempts three times and caused a significant breakout when it did break.
However, the 0.786 Fibonacci retracement level at $35.88 was not a price inflection point, as every candle ignored it on the way up and down. Sometimes a 0.50 Fibonacci retracement level will be a better support or resistance price than a 0.618 level. Combining them with other chart indicators is important to develop a trading strategy.
Fibonacci Extensions
While having a starting plot and ending plot line is crucial for Fibonacci retracement levels, what happens when the stock surpasses the start and end plot prices?
Fibonacci retracements are good when prices are inside the starting and ending point channels, but when the price exceeds the channels, there are no more Fibonacci retracement levels. In these cases, it's prudent also to add Fibonacci extension levels. The commonly used Fibonacci extension levels are 1.272, 1.414 and 1.618. You can continue them by replacing the first number sequentially. For example, 2.272, 2.414, 2.618, 3.272, 3.414 and 3.618.
FAQs
Here are answers to some frequently asked questions.
What is the best time frame to draw Fibonacci retracements?
It depends on your style of trading and analysis. Short-term intraday traders can still benefit from Fibonacci levels on a daily and weekly time frame. However, they can get more precision levels on as low as a 15-minute chart utilizing multi-day swing highs and lows as plot points. Swing traders and investors will benefit from the daily and wider time frames, such as weekly and monthly. The daily time frame would be the best Fibonacci retracement time frame.
What is the golden ratio of Fibonacci retracement?
The golden ratio is 0.618. It’s also referred to as the golden mean and the golden proportion. It can also be expressed as Φ (the Greek letter phi, the 21st letter in the Greek alphabet).
Evidence of the 0.618 can be found throughout nature, art, science, history, industries, commerce, psychology and the markets.
How accurate are Fibonacci retracements?
Sometimes they can be uncanny in accuracy, while others can be ineffective. Using them in conjunction with other price and momentum indicators is best. Since the prices are static, it's best to use Fibonacci retracement levels as potential price inflection points when the price approaches a level, especially the 0.618 and the 0.382 levels.
They prepare you to be ready to react or expect a reaction when stocks approach Fibonacci retracement price levels. They provide you with potential price support and resistance levels. Some call them coincidental, while others are true believers. It's best to test them out yourself and develop your own opinions.
Before you consider Intel, you'll want to hear this.
MarketBeat keeps track of Wall Street's top-rated and best performing research analysts and the stocks they recommend to their clients on a daily basis. MarketBeat has identified the five stocks that top analysts are quietly whispering to their clients to buy now before the broader market catches on... and Intel wasn't on the list.
While Intel currently has a Reduce rating among analysts, top-rated analysts believe these five stocks are better buys.