Emera (TSE:EMA - Get Free Report) had its target price cut by research analysts at Barclays from C$74.00 to C$71.00 in a note issued to investors on Monday,BayStreet.CA reports. Barclays's price target would suggest a potential upside of 0.41% from the stock's current price.
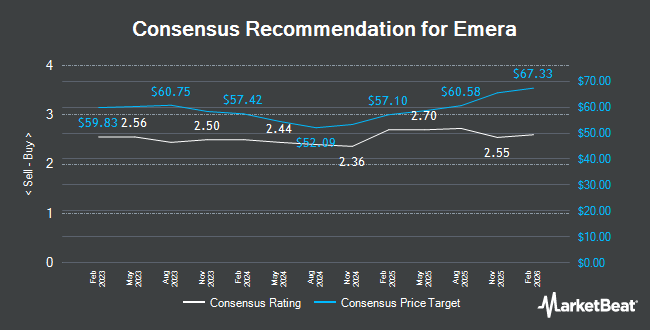
A number of other analysts have also recently weighed in on EMA. Scotiabank boosted their price target on Emera from C$78.00 to C$80.00 and gave the stock a "sector outperform" rating in a research report on Tuesday, July 21st. Royal Bank Of Canada raised their price objective on Emera from C$76.00 to C$84.00 and gave the company an "outperform" rating in a research note on Monday. TD boosted their price objective on shares of Emera from C$75.00 to C$77.00 and gave the stock a "buy" rating in a research note on Monday, May 11th. BMO Capital Markets upped their price objective on shares of Emera from C$76.00 to C$80.00 and gave the stock an "outperform" rating in a report on Wednesday, July 22nd. Finally, Raymond James Financial raised their target price on shares of Emera from C$75.25 to C$77.00 and gave the company an "outperform" rating in a research note on Monday. Six equities research analysts have rated the stock with a Buy rating and four have issued a Hold rating to the company's stock. According to MarketBeat, the stock has a consensus rating of "Moderate Buy" and an average price target of C$76.67.
Get Our Latest Analysis on EMA
Emera Stock Down 0.2%
Shares of EMA stock traded down C$0.17 during trading on Monday, hitting C$70.71. 472,689 shares of the company were exchanged, compared to its average volume of 1,231,897. The business's 50-day simple moving average is C$74.49 and its 200 day simple moving average is C$72.22. Emera has a twelve month low of C$63.17 and a twelve month high of C$77.99. The firm has a market capitalization of C$21.72 billion, a price-to-earnings ratio of 21.62, a P/E/G ratio of 6.20 and a beta of 0.57. The company has a debt-to-equity ratio of 153.87, a quick ratio of 0.23 and a current ratio of 0.73.
Emera (TSE:EMA - Get Free Report) last announced its quarterly earnings results on Friday, August 7th. The company reported C$0.69 EPS for the quarter. Emera had a return on equity of 7.51% and a net margin of 12.85%.The business had revenue of C$2.01 billion during the quarter. As a group, analysts forecast that Emera will post 3.1991627 EPS for the current fiscal year.
Insider Transactions at Emera
In other news, insider Richard Janega sold 16,500 shares of the stock in a transaction on Tuesday, June 16th. The shares were sold at an average price of C$74.25, for a total value of C$1,225,125.00. Following the completion of the transaction, the insider owned 19,642 shares in the company, valued at approximately C$1,458,418.50. This represents a 45.65% decrease in their position. 0.09% of the stock is owned by company insiders.
About Emera
(
Get Free Report)
Emera TSX/NYSE: EMA is a leading North American provider of energy services headquartered in Halifax, Nova Scotia, with investments in regulated electric and natural gas utilities, and related businesses and assets. The Emera family of companies delivers safe, reliable energy to approximately 2.7 million customers in the United States, Canada and the Caribbean. Our team of 7,800 employees is committed to our purpose of energizing modern life and delivering a cleaner energy future for all. Emera's common and preferred shares are listed and trade on the Toronto Stock Exchange and its common shares are listed and trade on the New York Stock Exchange.
Further Reading
This instant news alert was generated by narrative science technology and financial data from MarketBeat in order to provide readers with the fastest reporting and unbiased coverage. Please send any questions or comments about this story to contact@marketbeat.com.

Continue following MarketBeat
Add MarketBeat as your preferred source on Google to see our latest stories in your feed.
Before you consider Emera, you'll want to hear this.
MarketBeat keeps track of Wall Street's top-rated and best performing research analysts and the stocks they recommend to their clients on a daily basis. MarketBeat has identified the five stocks that top analysts are quietly whispering to their clients to buy now before the broader market catches on... and Emera wasn't on the list.
While Emera currently has a Moderate Buy rating among analysts, top-rated analysts believe these five stocks are better buys.
View The Five Stocks Here
Discover the next wave of investment opportunities with our report, 7 Stocks That Will Be Magnificent in 2026. Explore companies poised to replicate the growth, innovation, and value creation of the tech giants dominating today's markets.
Get This Free Report
Like this article? Share it with a colleague.
Link copied to clipboard.
