Darden Restaurants, Inc.'s NYSE: DRI stock is flashing a potential trend-following entry in late December after a sharp 2025 pullback.
The core thesis is straightforward: the long-term uptrend looks intact, momentum indicators are turning, and fundamentals—paired with institutional positioning—create a credible path to market-beating total returns in 2026 if the stock clears nearby resistance.
Darden Restaurants Pulls Back to Trend-Following Entry Point in Q4
Darden Restaurants Today
DRI
Darden Restaurants
$198.68 +2.94 (+1.50%) As of 11:02 AM Eastern
This is a fair market value price provided by Massive. Learn more. - 52-Week Range
- $169.00
▼
$220.65 - Dividend Yield
- 3.26%
- P/E Ratio
- 19.13
- Price Target
- $228.88
Weekly price action for DRI stock has been in an uptrend since 2014, marred only by COVID-19 volatility.
The more recent activity shows a robust 2024 uptrend that not only broke the price action out of an Ascending Triangle Pattern (a chart pattern in which a stock consolidates with flat, equal highs but progressively higher lows) but set a new all-time high. This action was driven by fundamental qualities, including growth, margin strength, and capital returns.
The 2025 price action is less obviously bullish, with the stock falling by 25% from its peak to the November 2025 low. However, the uptrend remains unbroken.
That drawdown isn’t pleasant, but it did two useful things for trend followers: it pulled price back toward long-term support and allowed momentum gauges to unwind from extended conditions.
It allowed indicators, including the moving average convergence divergence (MACD) and stochastic, to reset, indicating a market with room to run, and a critical exponential moving average (EMA) to catch up with the price action. The EMA in question is the 150-week EMA, an indicator of long-term, buy-and-hold, market support that has aligned with the DRI uptrend line for years. The takeaway in late December is that support at this crucial indicator is advancing, setting the stage for a robust rebound that has already begun.
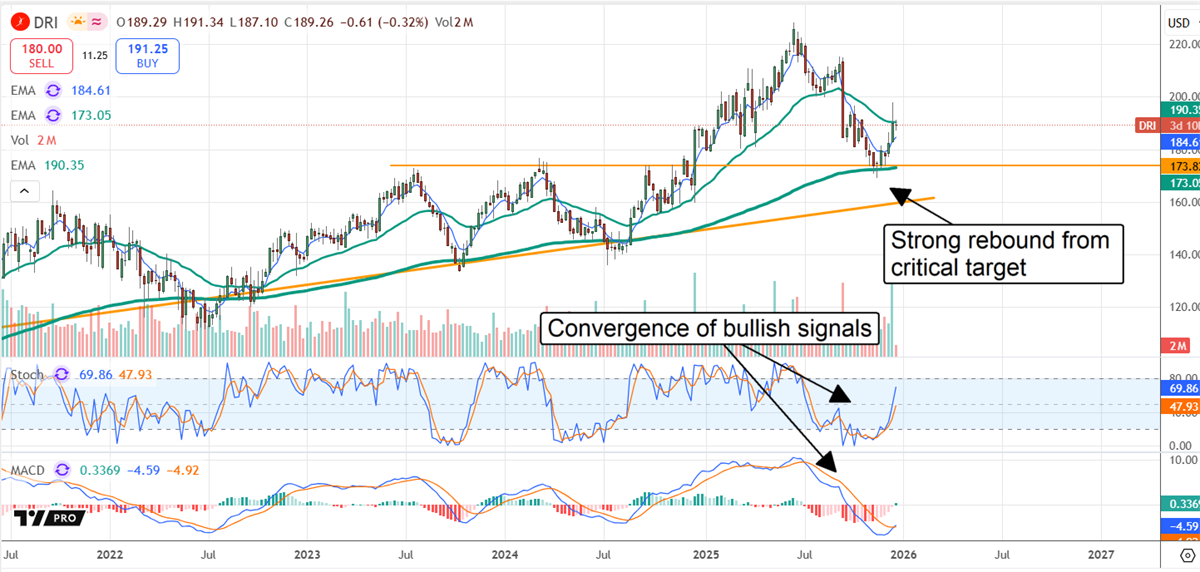
The MACD and stochastic indicators, which measure momentum and trend, clearly indicate a technical trend-following entry. The stock price rebound, compounded by bullish crossovers in stochastic and MACD, constitutes the trend-following entry signal and suggests an uptrending market that can easily retest its current highs and potentially move higher in 2026. Investors and traders will note, however, that the late-December price action reached a ceiling that must eventually be surpassed.
The Next Hurdle: Reclaiming the 150-Day EMA to Confirm Accumulation
Even with improving momentum, the chart still has an obvious test ahead: reclaiming the 150-day EMA. Many investors treat that line as a proxy for intermediate-term accumulation. When price is below it, rallies can stall. When price gets back above it and holds, it often signals that dip buyers are back in control.
Right now, the market appears to be digesting the rebound that followed the most recent earnings catalyst. A clean push above the 150-day EMA—followed by a successful retest—would add confirmation for traders who want more than just an initial bounce.
Earnings Catalyst: What Darden Just Reported and Why It Matters
Darden Restaurants Stock Forecast Today
12-Month Stock Price Forecast:$228.8816.93% UpsideModerate BuyBased on 27 Analyst Ratings | Current Price | $195.73 |
|---|
| High Forecast | $276.00 |
|---|
| Average Forecast | $228.88 |
|---|
| Low Forecast | $200.00 |
|---|
Darden Restaurants Stock Forecast DetailsThe earnings results for fiscal Q2 (FQ2) included a year-over-year growth acceleration to over 7%, outperformance, and substantial margin driven by core business and comp-store sales.
Cash flow and capital returns were also healthy, including the 3.1% yielding dividend and share buybacks.
Share buybacks are substantial, having reduced the count by 1.2% in the first fiscal half, and are expected to remain robust in the second fiscal half.
While results for restaurant stocks inspired the market action, analysts and institutions drive it. The FQ2 release triggered several price target increases and upgrades, affirming the Moderate Buy rating and a 20% upside forecast, and institutions are buying aggressively.
They own more than 90% of the stock, and their 2025 activity amounts to $2 in purchases for each $1 in sales. With this in play, DRI's downside is limited and its upside potential ample.
Before you consider Darden Restaurants, you'll want to hear this.
MarketBeat keeps track of Wall Street's top-rated and best performing research analysts and the stocks they recommend to their clients on a daily basis. MarketBeat has identified the five stocks that top analysts are quietly whispering to their clients to buy now before the broader market catches on... and Darden Restaurants wasn't on the list.
While Darden Restaurants currently has a Moderate Buy rating among analysts, top-rated analysts believe these five stocks are better buys.
View The Five Stocks Here
Learn the basics of options trading and how to use them to boost returns and manage risk with this free report from MarketBeat. Click the link below to get your free copy.
Get This Free Report
Like this article? Share it with a colleague.
Link copied to clipboard.