Markets move faster than ever these days, and yesterday’s winners can quickly become today’s losers. When prices outpace fundamentals, traders often rely on technical indicators and signals to guide their decisions. Momentum indicators like the Relative Strength Index (RSI) don’t have prophetic powers, but they do give clues about where a stock might be headed and how much strength backs the move. Using a combination of indicators together can provide solid evidence that a downtrend is about to break. Or, in the case of these three stocks, that an uptrend is losing momentum.
The tech sector has been one of the most volatile parts of the market over the past few weeks, with the Nasdaq 100 fluctuating by more than 2% in a single day on multiple occasions. While volatile trading sessions make for fun times for day traders, it can be difficult to gauge the market when indices swing by 2% every day. That’s where technical analysis comes into play. Technical indicators utilize recent price data to generate actionable signals about shifts or continuations in momentum. By applying technical analysis, we can make educated predictions about a stock’s future path based on the intensity of buying or selling activity around it.
Each of the following three stocks fits a specific set of criteria. All three have gained 20% or more over the last 12 months, driven by various fundamental and macro factors. However, these stocks are currently showing technical warning signs that investors should carefully examine.
Fortinet: Overbought Peak With Insider Selling Warning
Fortinet Today
$146.30 0.00 (0.00%) As of 06/12/2026 04:00 PM Eastern
- 52-Week Range
- $70.12
▼
$150.07 - P/E Ratio
- 56.49
- Price Target
- $107.77
Fortinet Inc. NASDAQ: FTNT has been the face of the “software isn’t dead” narrative. The $106 billion cybersecurity firm has seen its stock accelerate more than 80% year-to-date (YTD), including more than 70% in the past three months alone.
The software sector seemed to be in the crosshairs of agentic AI, and funds like the iShares Expanded Tech-Software Sector ETF BATS: IGV lost more than 35% of their value between September and April. However, strong earnings from companies like Fortinet showed that AI can complement software platforms rather than wipe them out. Fortinet smashed expectations in Q1 2026, beating both top and bottom line estimates and posting 20% year-over-year (YOY) revenue growth.
Management also raised full-year guidance and repurchased more than $800 million worth of stock. So why is this stock on a “time to sell” list? Because sometimes the most important technical signals aren’t shown on the charts. Insiders have been selling stock at a faster rate over the last two quarters, including a $23 million sale from CEO Ken Xie.
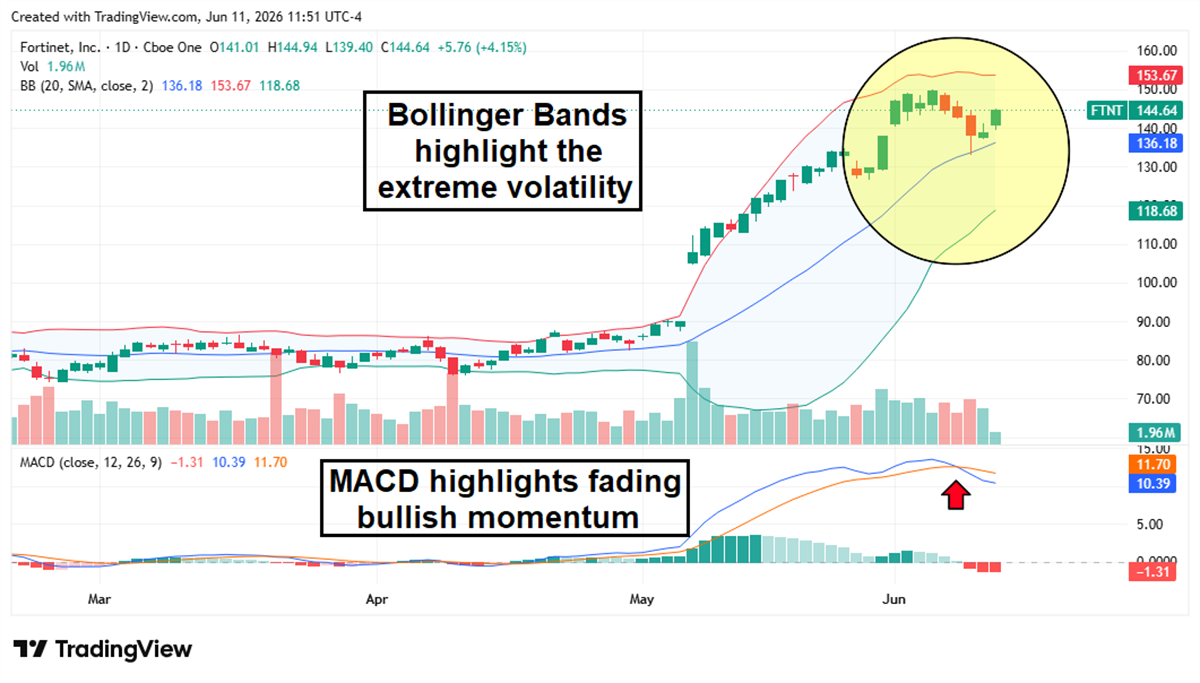
There has been no significant insider buying in the past year, and insider selling at a technical top is often a warning sign. Widening Bollinger Bands indicate that volatile trading has become the norm for FTNT shares, and the Moving Average Convergence Divergence (MACD) indicator has turned bearish following the strong rally. The company’s long-term fundamentals still look promising, but it might be wise to take some short-term profits now.
Amprius: Technical Breakdown Amid Negative Catalysts
Amprius Technologies Today
AMPX
Amprius Technologies
$16.30 -0.01 (-0.06%) As of 06/12/2026 03:59 PM Eastern
This is a fair market value price provided by Massive. Learn more. - 52-Week Range
- $3.43
▼
$24.23 - Price Target
- $21.67
Amprius Technologies Inc. NYSE: AMPX lacks the strong fundamental foundation that Fortinet has, which means its downturn could be much sharper.
The lithium-ion battery producer is beating revenue estimates, and its stock is still up more than 100% YTD, but the rally is faltering amid concerns about the quality of its revenue. A recent report by a short-seller claims that the company inflates its orders and engages in undisclosed transactions with a related party affiliated with Amprius’s CEO.
The company also reported a larger-than-expected loss in its Q1 2026 earnings report on May 6, and insiders have sold $83 million worth of shares over the last three quarters, without a single buy.
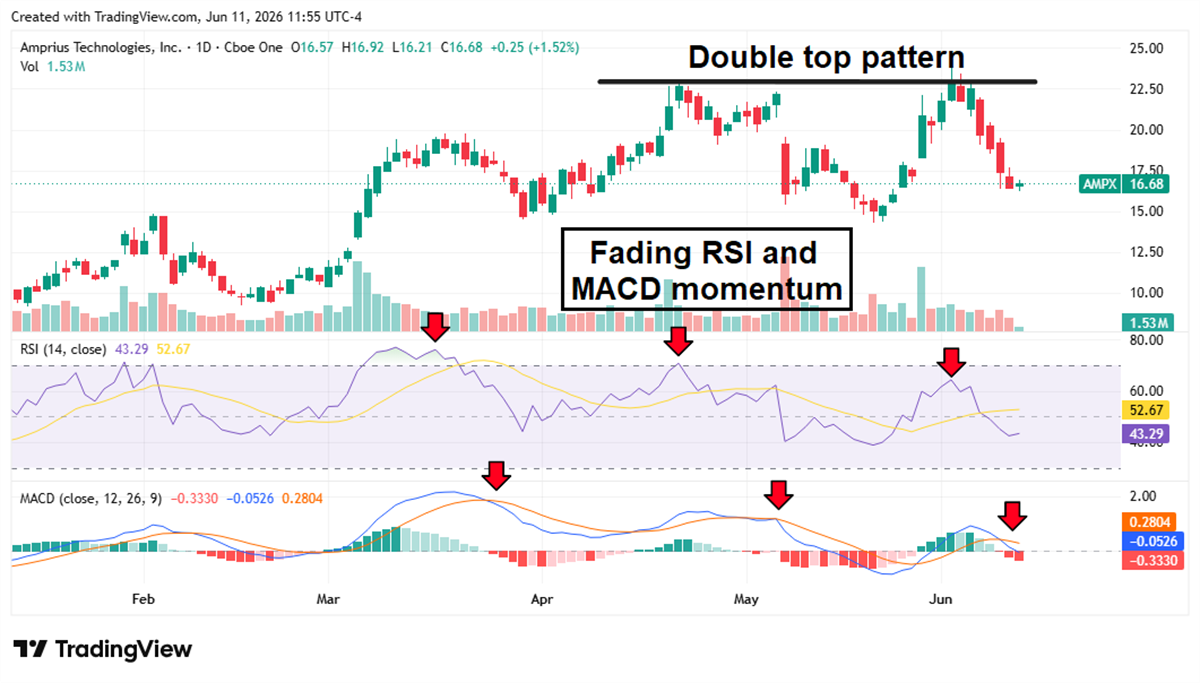
AMPX might be heading for the dreaded double top pattern, and other signals suggest that the fun is over. Both the RSI and MACD have been trending down since the middle of March, and now the former has spent most of the last six weeks in bearish territory. AMPX isn’t profitable yet, and short sellers are openly questioning its revenue streams, so it would be wise to avoid this stock or take profits while you can.
AppLovin: Death Cross Overshadows Fundamental Strength
AppLovin Today
$496.77 0.00 (0.00%) As of 06/12/2026 04:00 PM Eastern
- 52-Week Range
- $320.00
▼
$745.61 - P/E Ratio
- 42.68
- Price Target
- $669.62
AppLovin Corp. NASDAQ: APP is already down more than 25% YTD, even though it grew revenue by more than 56% in Q1 2026, and remains well-regarded by analysts. But despite a strong fundamental picture, the stock is in the throes of a bear market that’s proving difficult to shake.
It may seem counterintuitive, but APP shares probably won’t reflect the company’s strength until the technical setup improves.
An early-March Death Cross indicated the stock has a long way to go before regaining buying momentum.
The Death Cross sent the stock plunging under the 50-day and 200-day moving averages, where it stayed until late May.
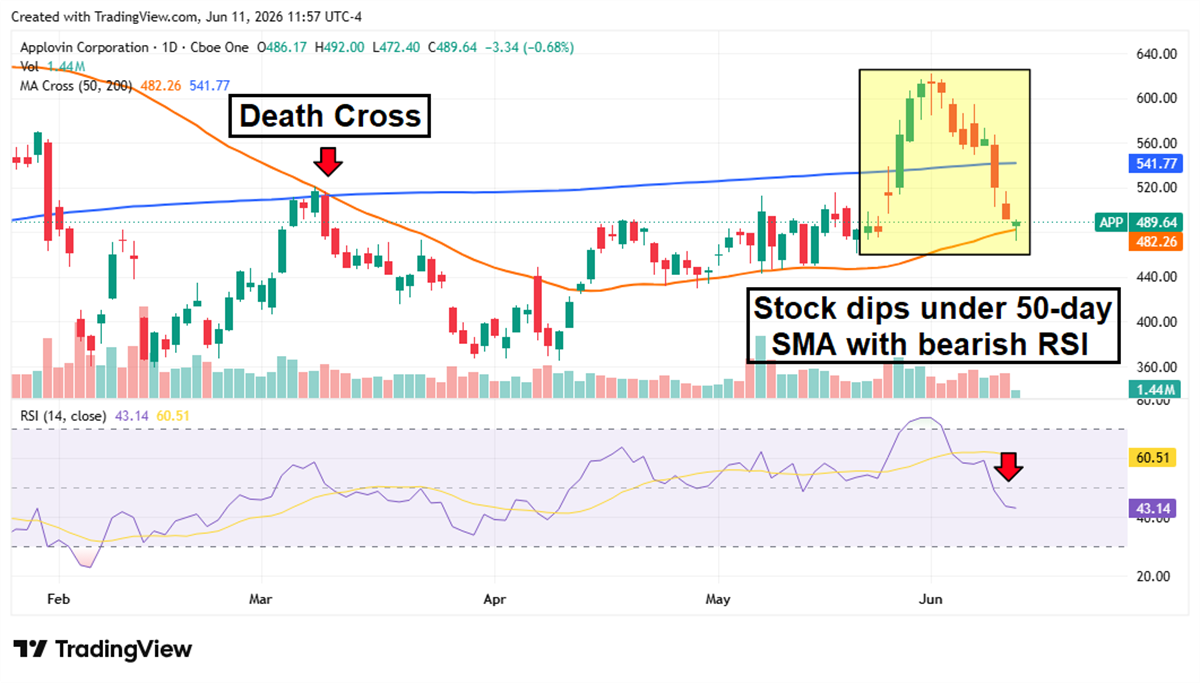
APP shares tried to break out at the end of May, but sellers quickly pushed the share price back below the 200-day moving average, and now it's once again testing the 50-day moving average. With the RSI also below 50, APP shares can remain on your watchlist until they make a significant move above the 50-day moving average.
Before you consider Fortinet, you'll want to hear this.
MarketBeat keeps track of Wall Street's top-rated and best performing research analysts and the stocks they recommend to their clients on a daily basis. MarketBeat has identified the five stocks that top analysts are quietly whispering to their clients to buy now before the broader market catches on... and Fortinet wasn't on the list.
While Fortinet currently has a Hold rating among analysts, top-rated analysts believe these five stocks are better buys.
View The Five Stocks Here
Looking to profit from the electric vehicle mega-trend? Click the link to see our list of which EV stocks show the most long-term potential.
Get This Free Report
Like this article? Share it with a colleague.
Link copied to clipboard.