Stock prices fluctuate every day. You may wonder, "Is there a method to this madness?" Stock prices can rise on bad news, fall on good news, and do both on no news.
However, when you routinely watch a stock long enough, you will notice its price tends to gravitate towards and fall toward certain price levels, called support and resistance levels, acting like bumpers in a pinball machine. Stock prices tend to ricochet and deflect around these particular levels.
Support and resistance levels can help you define your entries and exits on trades. This article will explain how to identify support and resistance levels in stocks. We'll also explain what support and resistance means and how to use these levels to make better trading and investing decisions.
Understanding Support and Resistance
When buying pressure pushes a stock price higher, but the price can't rise beyond a specific price level, it's hitting a resistance level. At this price level, too much stock is available for sale. In purely economic terms, the stock supply outstrips the demand to buy.
The effect of a resistance level is that the stock price will peak and fall back down as buying pressure softens. For example, if XYZ price rises two points to $55 but fails to break any higher and reverses back to $54, then the $55 price level is a confirmed resistance level.
The opposite holds for support. When a stock continues to sell off until it hits a price level it no longer falls below, that price is called a support level. Support levels have tremendous buying demand, preventing the stock from falling lower. Buyers are willing and able to buy stock at support levels.
The effect of a support level usually comes in the form of a reversal bounce higher as selling pressure dissipates. For example, if XYZ falls two points to $53 and bounces back to $54, then $53 is a confirmed support level.
Why Support and Resistance Levels Matter
From the surface, stock prices may appear to be chaotic and random. However, when you chart the price action, some price levels appear consistently as price inflection points. These are stock support and resistance levels.
Support and resistance trading is based on the principle of supply and demand. When a stock price falls, it implies more selling pressure as supply swells and demand dries. This is illustrated by the bid prices falling as ask prices fall. Eventually, prices fell to a level where buyers would step up and absorb the selling. That is a price support level.
When demand is strong for a stock, the price rises. The bidders raise their bid prices, while sellers also raise their offer prices. Eventually, the stock reaches a price level where more sellers emerge, offering to sell more and more shares while the buyers start to lose interest at the higher prices and pull back their bids. This price level is a resistance because the price resists the attempt to move higher.
Market Psychology
Human psychology has a lot to do with support and resistance levels. This is because fear and greed are the two emotions that drive the markets. Support levels form from the concentration of buying demand around certain price levels. Selling occurs out of fear that prices will fall further. However, that fear dissipates as a stock's price reaches a support level.
Price Reversals and Bounces
Buyers will dip their toes to create a support level when selling pressure depletes as prices fall. As the buyers absorb the selling, the bids swell as the price ticks back up. When there are motivated buyers, they will raise their bid prices as supply gets taken out on the offer; it gets more buyers' interest and is off the fence and short sellers to cover to avoid taking losses.
At this point, greed takes over as buyers jump back into the stock. If the stock makes a reversal, it can trigger more buying. If the stock rises to the resistance level and breaks out, investors may experience the fear of missing out (FOMO). This phenomenon causes a buying frenzy to new resistance levels as the old resistance becomes a support level.
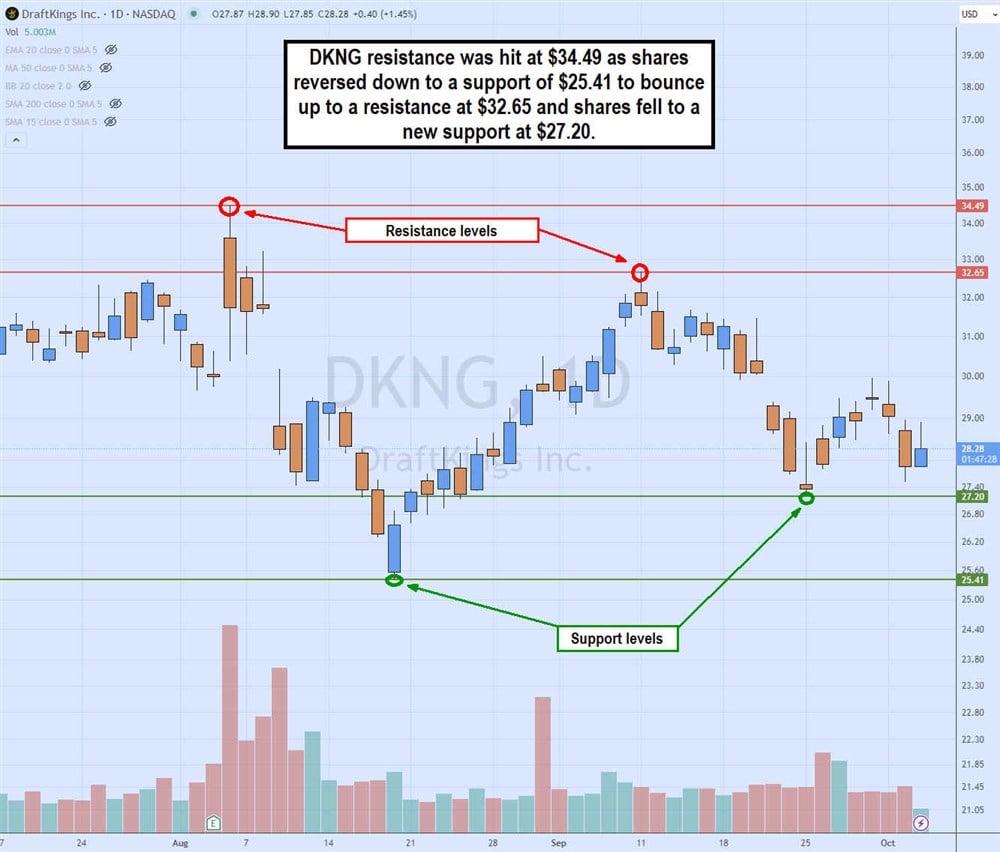
The daily candlestick chart on Draft Kings Inc. (NASDAQ: DKNG) illustrates the resistance levels with red horizontal trend lines and support levels with green horizontal support lines. DKNG peaks at the $34.49 resistance level and reverses back down to a support level of $25.41 as buyers step in to bounce the stock back up to a new resistance level at $32.65.
Upon peaking at $32.65, selling reverses DKNG to a new support of $27.20 as buyers bid back up the stock. Support and resistance levels can be good entry or exit levels on longs and shorts.
Identifying Support and Resistance Levels
Identifying stock support and stock resistance levels can be simplified by utilizing stock charts, like candlesticks or bar charts. It's also important to prioritize the time period since a smaller time frame may have a different support resistance than a longer chart. Let's look at how to find levels of support and resistance using candlestick charts.
Analyzing Price Charts
Using candlestick charts, you can use multiple methods to find support and resistance levels. The simplest method is to apply a moving average indicator to the stock chart. Moving averages are great indicators of support and resistance. Most charting platforms have basic indicators, like moving average lines. You must select the number of periods and the time frame for the moving average. Some commonly used periods are the 5, 15, 20, 50 and 200.
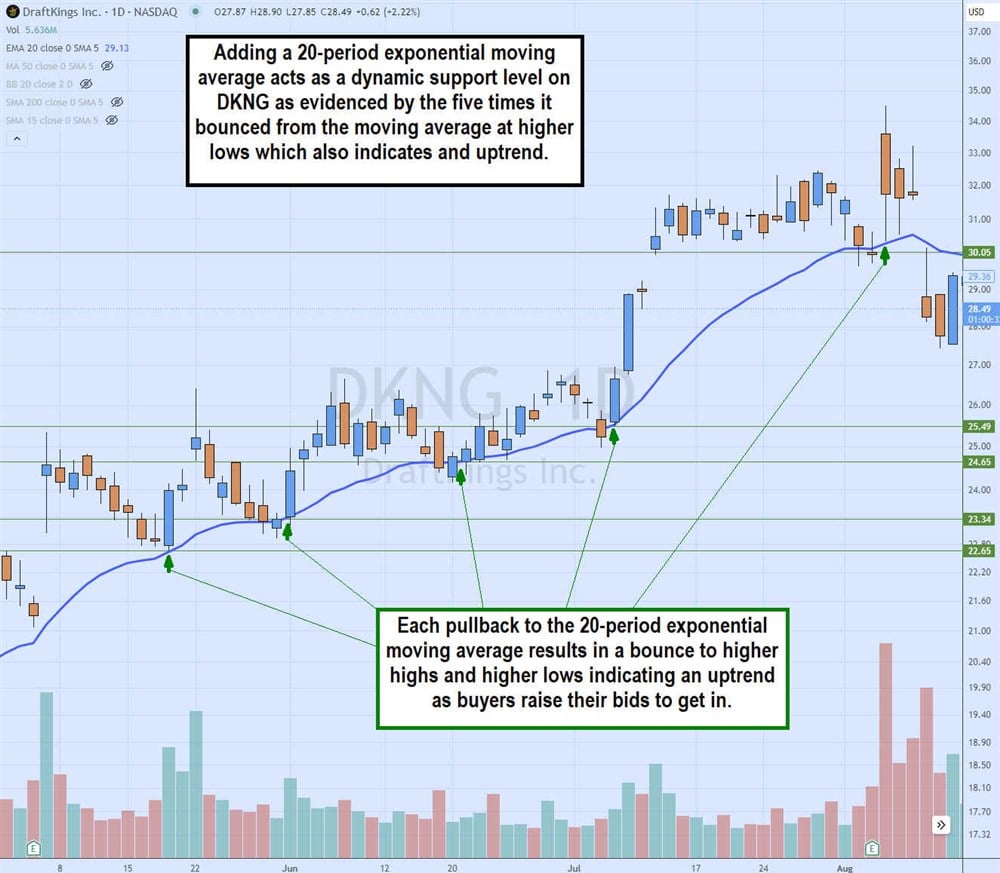
The daily candlestick chart on DraftKings has a 20-period exponential moving average line. Observe how the price bounces off the 20-period exponential moving average, making higher lows on pullbacks. As DKNG makes higher highs on the bounces and higher lows on the pullbacks, it illustrates the uptrend driven by buying demand as buyers step in front of each other, bidding higher for shares. DKNG bounced five consecutive times as the 20-period exponential moving average rose from $22.65 on its first bounce to $30.05 on the final bounce. The 20-period exponential moving average could be traded as an entry-level to buy long into an uptrend and a trailing stop-loss if you are already long DKNG.
Drawing Trendlines and Horizontal Lines
While moving averages are dynamic support and resistance levels, horizontal and diagonal trendlines are static support and resistance lines. Most charting platforms and software have drawing tools that enable you to plot horizontal and diagonal trendlines.
You can draw horizontal trendlines when a price level holds support or resistance twice or more. Learning how to draw support and resistance lines can be done with repetition and practice. The more you do, the more you improve. A resistance level can turn into a support level if it breaks out. A support level can turn into a resistance level if the stock breaks down through the support level.
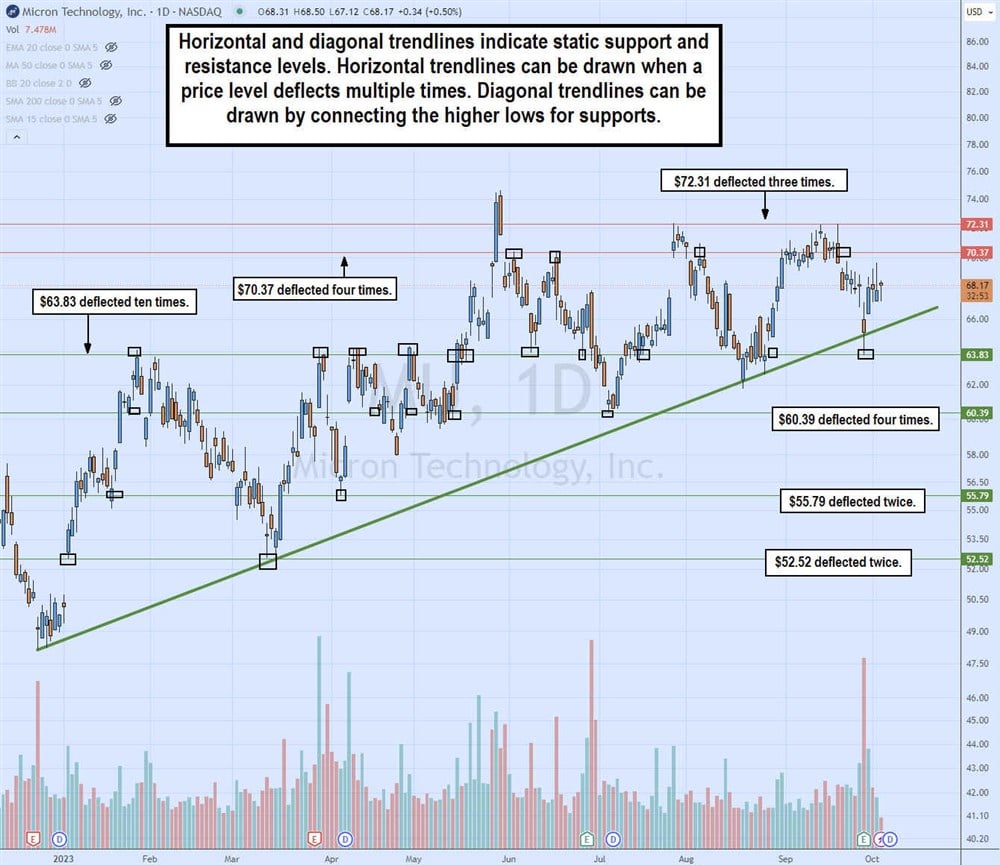
The MU daily candlestick chart illustrates the four horizontal green support lines and two red horizontal resistance lines. Each time the price level deflects, meaning bounces off of or rejects off of, is noted by the black square on the chart. The most widely deflected price level is the $63.83 support level for having deflected or bounced 10 times. The historical price chart proves this would be a major support level.
The $70.37 resistance level was deflected or rejected four times. This indicates a major resistance level, as indicated by the historical resistance at that level. Using the horizontal trendlines alerts you to the potential for a bounce if MU falls to $63.83 for a possible long trade. MU sets up a possible short sell if it bounces to $70.37 resistance as it rejected four breakout attempts.
Diagonal trendlines indicate a trend by connecting the higher lows on an uptrend or the lower highs on a downtrend. Diagonal higher lows indicate the uptrend support levels. Diagonal lower highs indicate lower highs on a downtrend. These trendlines can be entry and exit areas for long and short trades.
Types of Support and Resistance Levels
Not all support and resistance levels are the same. Some support levels are stronger or carry more weight than others. The same applies to resistance levels. The significance of the major and minor levels can also change as a stock price moves beyond the levels.
Major vs. Minor Levels
Major support levels can be gauged in two ways. With moving averages, the wider time frames, like the 50-period and 200-period moving averages, carry the most significant weighting. These two moving averages are the components of the golden cross breakout pattern and the death cross breakdown pattern.
With horizontal and diagonal trendlines, the major trendline is determined by how often the trendline has been deflected and proved to be a key inflection point. The $63.83 support level was tested ten times in the MU candlestick chart, making it a major support level. The $70.37 price level was the major resistance, as it was rejected four times.
Dynamic vs. Static Levels
Moving averages are dynamic support and resistance levels because they get recalculated on every candle close or start of a new candle for the period. The moving average is formed mathematically by averaging the close prices for each period. If trades are closed at higher prices, the moving average rises, and the moving average support rises.
Horizontal and diagonal trendlines are static since they don’t change values like a moving average. These trendlines are created by connecting the highs and lows of a stock with a single trendline per level. The trendline visualizes them and doesn't change since they are based on historical price inflection points.
Fibonacci retracement levels are also static support and resistance levels. These levels are created by plotting a swing high to a swing low and back to the swing high. The 0.618, 0.50, and 0.382 are the most significant. However, the subjective part is determined by where you start and end your plots.
Strategies for Using Support and Resistance
Support and resistance in trading involves trading breakouts, breakdowns, reversions and oscillations.
Breakouts and Breakdowns
Breakouts and breakdowns can be traded when a stock rises through a resistance level or under a support level. A breakout can also be played after a stock bottoms out at a support level and then triggers a price action pattern like a market structure low (MSL), which is comprised of a low, lowest low and higher low.
The break of the higher low is your trigger to take a long position in a stock after it has based on the support level. The sell or sell short trigger forms when a market structure high (MSH) forms after a high, highest high and lower high set near a resistance. The low of the lower-high candle is the trigger to sell the stock as it becomes a resistance level stock.
Trading Ranges
Trading ranges can find support levels containing a price level when the stock falls and resistance levels containing the price level when a stock bounces. Playing reversals at the support and resistance levels is an example of using trading ranges.
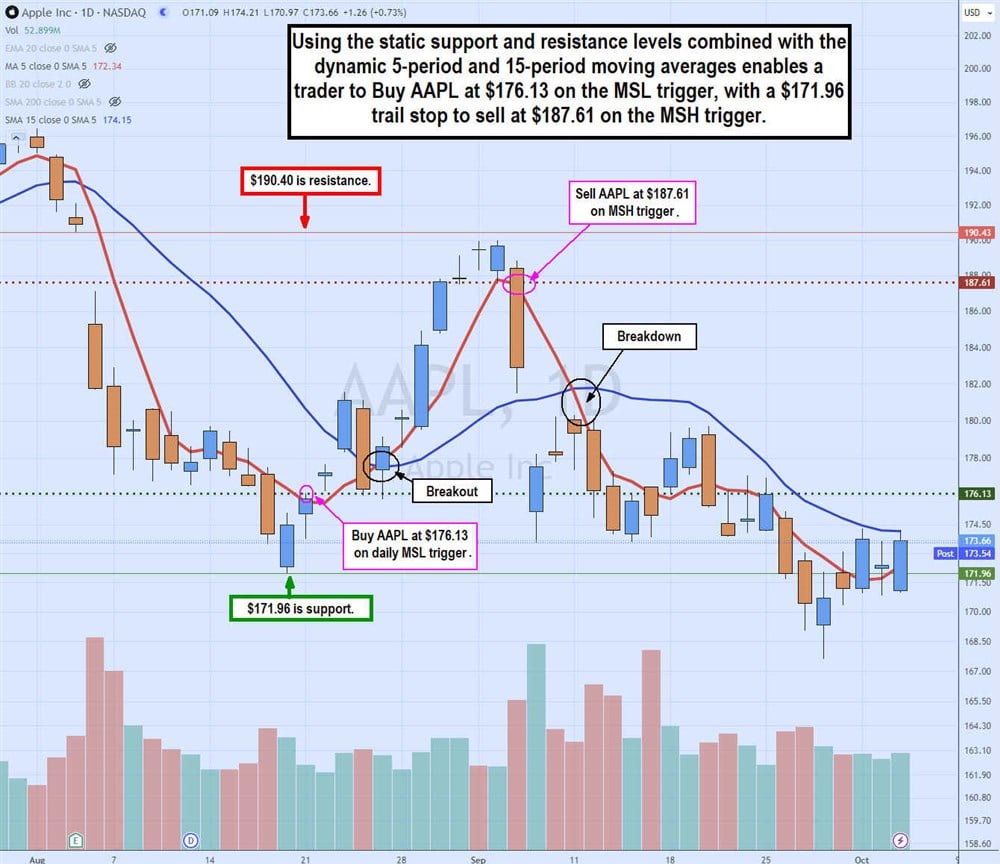 The Apple Inc. NASDAQ: AAPL daily candlestick chart illustrates the breakdown plunge in earnings. The $190.43 closing price before the earnings report caused a gap down and continued selling on the breakdown.
The downtrend is depicted by the daily 5-period moving average (red line) followed by the 15-period moving average (blue line). AAPL finds support at $171.96 after consecutive candles making lower lows. The first higher low candle sets the MSL trigger at $176.13, the high of the higher low candle. A long entry on AAPL at $176.13 can be taken with a trailing stop under the preceding low of $171.96 support.
The moving average breakout occurs when the 5-period moving average crosses up through the 15-period moving average at $178. The uptrend continues as AAPL bounces, with the 5-period moving average support rising. As AAPL nears the $190.40 gap resistance level, it peaks and forms an MSL trigger at $187.61.
This is the signal to sell your long position in AAPL at $187.61. This is also a signal to short-sell AAPL on the MSH trigger at $187.61, with a stop-loss set on a breakout of the $190.43 resistance. The 5-period moving average crosses through the 15-period moving average when AAPL falls below $180 as shares fall below the $176.13 MSL trigger. The falling five-period moving average is a resistance support if you are short. However, the MSL trigger is an ideal spot to take profits on the short trade.
Risk Management
Support and resistance levels are also great stop-loss or profit-stop levels. The static horizontal trendline price levels make good entries and exits on breakouts and breakdowns. Dynamic indicators like moving averages enable more relevant stop-loss and profit-stop price levels, especially when combined with market structure signals.
To further temper risk, it's important to manage your position sizes. Intraday trading can afford more position sizing than swing trades, which deal with wider time frames. The position size should be proportionate to the time frame. The support and resistance levels enable you to place entry price targets, giving you adequate risk and reward scenarios.
The AAPL Long trade at $176.13 MSL trigger has the upside to the $190.43 resistance level, a $14.30 profit. The stop-loss would be a breakdown under the $171.96 support, or $4.17. With an upside profit potential of $14.30 versus a downside stop-loss potential of $4.17, the risk-to-reward ratio is roughly 1 to 3.4. This is a great risk-to-reward ratio, which indicates I can make $3.40 for each $1 of risk taken.
Putting it All Together
Let's look at the daily candlestick chart for DKNG. The horizontal support is $25.41, as indicated by the green horizontal trendline. The major resistance level is $31.61 after having DKNG rejected eight times under it. There is a secondary resistance at $32.45.
The game plan is to sell your position at the major resistance or sell a partial position there and the rest as it climbs to the next resistance at $32.45. A profit stop can be used at the major resistance level breakdown at $31.61, the daily MSH trigger at $30.65 or the five-period moving average crossover through the 15-period moving average breakdown.
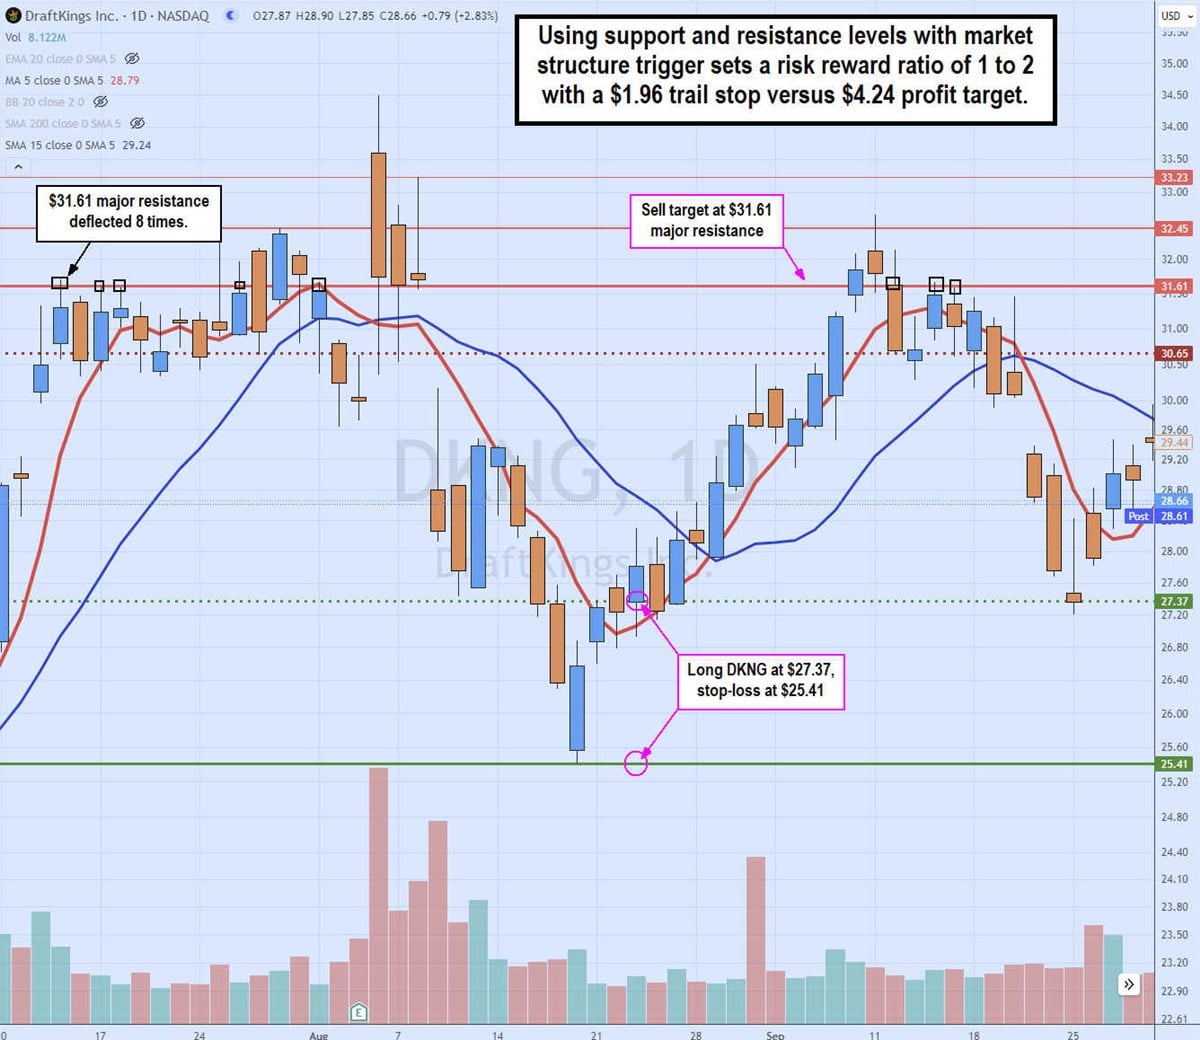
The trade would be long DKNG at $27.37 on the daily MSL trigger, with a stop-loss at $25.41. The upside target is the $31.61 major resistance level, which deflected most horizontal resistance levels. The risk is a stop-loss of $1.96, and the reward is the target of $31.61 for a profit of $4.24. The risk-to-reward ratio is around 2 to 1. This is still a good risk-to-reward ratio and worthy of a trade.
Make Smarter Trades with MarketBeat
You can use many tools to help you find resistance and support price levels from the MarketBeat breakout stocks list. Bollinger Bands are another dynamic price indicator that quantifies the trading range, trend and compression or expansion phase. Active stocks with volume are the best candidates to identify resistance and support. You can find plenty of active stock candidates with the MarketBeat earnings beats and misses list.
Before you consider Apple, you'll want to hear this.
MarketBeat keeps track of Wall Street's top-rated and best performing research analysts and the stocks they recommend to their clients on a daily basis. MarketBeat has identified the five stocks that top analysts are quietly whispering to their clients to buy now before the broader market catches on... and Apple wasn't on the list.
While Apple currently has a Moderate Buy rating among analysts, top-rated analysts believe these five stocks are better buys.
View The Five Stocks Here
Discover the 10 Best High-Yield Dividend Stocks for 2025 and secure reliable income in uncertain markets. Download the report now to identify top dividend payers and avoid common yield traps.
Get This Free Report