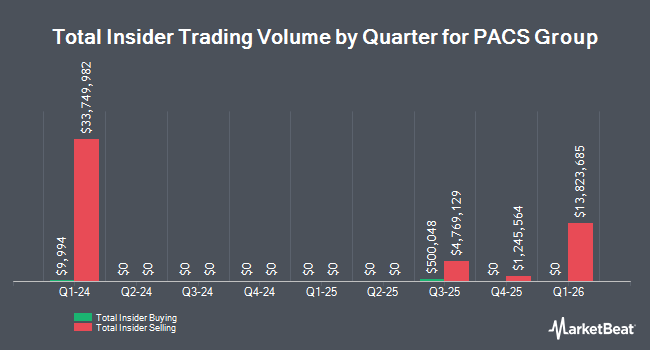
PACS Group, Inc. (NYSE:PACS - Get Free Report) CEO Jason Hulse Murray sold 59,244 shares of the business's stock in a transaction that occurred on Friday, August 21st. The stock was sold at an average price of $43.90, for a total value of $2,600,811.60. Following the transaction, the chief executive officer owned 54,694,866 shares in the company, valued at approximately $2,401,104,617.40. This represents a 0.11% decrease in their ownership of the stock. The sale was disclosed in a legal filing with the Securities & Exchange Commission, which is accessible through the SEC website. The transaction was executed under a pre-arranged Rule 10b5-1 trading plan.
Jason Hulse Murray also recently made the following trade(s):
- On Thursday, August 20th, Jason Hulse Murray sold 91,306 shares of PACS Group stock. The shares were sold at an average price of $43.92, for a total value of $4,010,159.52.
- On Wednesday, August 19th, Jason Hulse Murray sold 84,717 shares of PACS Group stock. The stock was sold at an average price of $44.26, for a total value of $3,749,574.42.
- On Tuesday, August 18th, Jason Hulse Murray sold 66,797 shares of PACS Group stock. The stock was sold at an average price of $44.18, for a total value of $2,951,091.46.
- On Monday, August 17th, Jason Hulse Murray sold 84,602 shares of PACS Group stock. The shares were sold at an average price of $44.16, for a total value of $3,736,024.32.
PACS Group Trading Up 0.1%
Shares of PACS traded up $0.03 during midday trading on Monday, reaching $44.28. The company had a trading volume of 544,951 shares, compared to its average volume of 928,421. PACS Group, Inc. has a 1-year low of $7.50 and a 1-year high of $49.49. The company has a quick ratio of 0.91, a current ratio of 0.91 and a debt-to-equity ratio of 0.21. The firm has a 50 day simple moving average of $43.54 and a 200-day simple moving average of $38.54. The stock has a market cap of $7.01 billion, a PE ratio of 25.75, a price-to-earnings-growth ratio of 1.25 and a beta of -0.08.
PACS Group (NYSE:PACS - Get Free Report) last announced its quarterly earnings results on Tuesday, August 4th. The company reported $0.63 earnings per share for the quarter, beating the consensus estimate of $0.54 by $0.09. PACS Group had a net margin of 4.85% and a return on equity of 29.55%. The firm had revenue of $1.43 billion for the quarter, compared to analysts' expectations of $1.41 billion. Research analysts forecast that PACS Group, Inc. will post 2.36 EPS for the current fiscal year.
Institutional Inflows and Outflows
Several hedge funds have recently bought and sold shares of PACS. Cubist Systematic Strategies LLC purchased a new stake in shares of PACS Group in the 1st quarter valued at approximately $198,000. MIRAE ASSET GLOBAL ETFS HOLDINGS Ltd. increased its holdings in PACS Group by 6.6% in the 1st quarter. MIRAE ASSET GLOBAL ETFS HOLDINGS Ltd. now owns 23,280 shares of the company's stock valued at $262,000 after purchasing an additional 1,443 shares during the last quarter. Millennium Management LLC raised its position in PACS Group by 68.3% in the first quarter. Millennium Management LLC now owns 859,295 shares of the company's stock valued at $9,658,000 after purchasing an additional 348,743 shares during the period. Jones Financial Companies Lllp acquired a new position in PACS Group during the first quarter worth $64,000. Finally, Caxton Associates LLP acquired a new position in PACS Group during the first quarter worth $163,000.
Analyst Upgrades and Downgrades
PACS has been the topic of several recent analyst reports. Royal Bank Of Canada boosted their target price on shares of PACS Group from $52.00 to $57.00 and gave the company an "outperform" rating in a report on Thursday, August 6th. UBS Group lifted their price target on shares of PACS Group from $57.00 to $60.00 and gave the company a "buy" rating in a research report on Thursday, August 6th. Oppenheimer upped their price objective on PACS Group from $48.00 to $57.00 and gave the company an "outperform" rating in a report on Monday, August 10th. Wall Street Zen lowered PACS Group from a "strong-buy" rating to a "buy" rating in a research report on Saturday, August 8th. Finally, Weiss Ratings cut PACS Group from a "hold (c+)" rating to a "hold (c)" rating in a research note on Wednesday, August 5th. One analyst has rated the stock with a Strong Buy rating, five have assigned a Buy rating and one has assigned a Hold rating to the stock. According to MarketBeat, the stock currently has an average rating of "Buy" and a consensus price target of $56.00.
Get Our Latest Analysis on PACS Group
PACS Group Company Profile
(
Get Free Report)
PACS Group, Inc, through its subsidiaries, operates skilled nursing facilities and assisted living facilities in the United States. The company also provides senior care and independent facilities. It engages in the acquisition, ownership, and leasing of health care-related properties. The company was founded in 2013 and is based in Farmington, Utah.
See Also
This instant news alert was generated by narrative science technology and financial data from MarketBeat in order to provide readers with the fastest reporting and unbiased coverage. Please send any questions or comments about this story to contact@marketbeat.com.
Before you consider PACS Group, you'll want to hear this.
MarketBeat keeps track of Wall Street's top-rated and best performing research analysts and the stocks they recommend to their clients on a daily basis. MarketBeat has identified the five stocks that top analysts are quietly whispering to their clients to buy now before the broader market catches on... and PACS Group wasn't on the list.
While PACS Group currently has a Moderate Buy rating among analysts, top-rated analysts believe these five stocks are better buys.
View The Five Stocks Here
Discover the 10 Best High-Yield Dividend Stocks for 2026 and secure reliable income in uncertain markets. Download the report now to identify top dividend payers and avoid common yield traps.
Get This Free Report
Continue following MarketBeat
Add MarketBeat as your preferred source on Google to see our latest stories in your feed.
Like this article? Share it with a colleague.
Link copied to clipboard.
