The
Global X U.S. Infrastructure Development ETF BATS: PAVE has been grinding to all-time highs on the heels of the
housing boom and anticipation of passing the Biden infrastructure bill through the American Jobs Plan. Raw materials and
building materials costs have been skyrocketing as
steel prices have nearly doubled and lumber prices tripling since Q2 2020. The initiative to fix the nation’s highways, roads, and bridges is finally coming to fruition as the Biden administration goes into deep negotiations on its proposed
infrastructure spending. It can be confusing trying to select individual benefactors of the Infrastructure spending ranging from industrials, materials, construction equipment, shippers, logistics companies and so forth. The PAVE ETF is a one-stop shop for this with the top concentrations in the industrials (64.4%), materials (22.5%), and information technology (5.2%). Prudent investors looking for a simpler way to gain exposure in U.S. infrastructure development, can monitor PAVE shares for opportunistic pullback levels.
PAVE ETF Stats
The PAVE ETF was launched on March 6, 2017. The investment theme is to invest in companies that will benefit from an increase in U.S. infrastructure activity including those involved in raw materials, heavy equipment, engineering, and construction. There are currently 100 holdings (which fluctuate between 100 to 111 at times) with a net assets of $2.827 billion, as of April 15, 2021. The ETF has carries a price-to-earnings (PE) of 32.50 and price-to-book (PB) of 3.58 with a 1.36 beta against the S&P 500. It’s a five star rated Morning Star fund based on risk-adjusted returns. The expense ratio is 0.47%.The year-to-date (YTD) is 21.03% versus the S&P 500 of 11.5%, as of April 16, 2021. Historically speaking, PAVE is expensive carrying lofty multiples.
Top Holdings
PAVE is conservative in its allocations with the largest holding being Deere & Co. NYSE: DE with 3.26% of total assets, followed by Parker Hannifin NYSE: PHat 3.01%, Sempra Energy NYSE: SRE at 2.94%, and Eaton Corp NYSE: ETN. Aside from Caterpillar NYSE: CAT, which the ETF has no positions, Deere is the top-heavy machinery position as its portfolio of machinery products are commonly used for everything from road building, earthmoving, crushing, screening, and excavating. Parker Hannifin provides sealing, filtering, shielding, contaminant removal and filtering solutions. Sempra Energy distributes electricity and natural gas to over 20 million customers in Southern California and 10 million customers in Texas, through its majority stake in Oncor. It decided to split itself into a utility business (electric and clean energy including solar and wind) and an infrastructure platform through its Sempra Infrastructure partners integrating its IEnova (Mexico renewable and gas) business and LNG business. Eaton Corp specializes in power management providing electrical components along with electrical transmission and distribution infrastructure buildout and improvement services. PAVE owns a number of railroad stocks that provide the critical logistics and transportation needs of the raw materials and building supplies to reach the construction sites.
Valuation
PAVE is expensive at a PE 35X and a number of factors could trigger sell-offs. Any disruptions with the underlying stocks or infrastructure spending negotiations can trigger volatility. However, the strong uptrend in industrials powered by outsized earnings and momentum can’t be overlooked. Prudent investors should administer patience to see how the Q2 2021 earnings season pans out to find opportunistic pullback levels that meet their risk tolerance levels.
PAVE Opportunistic Pullback Levels
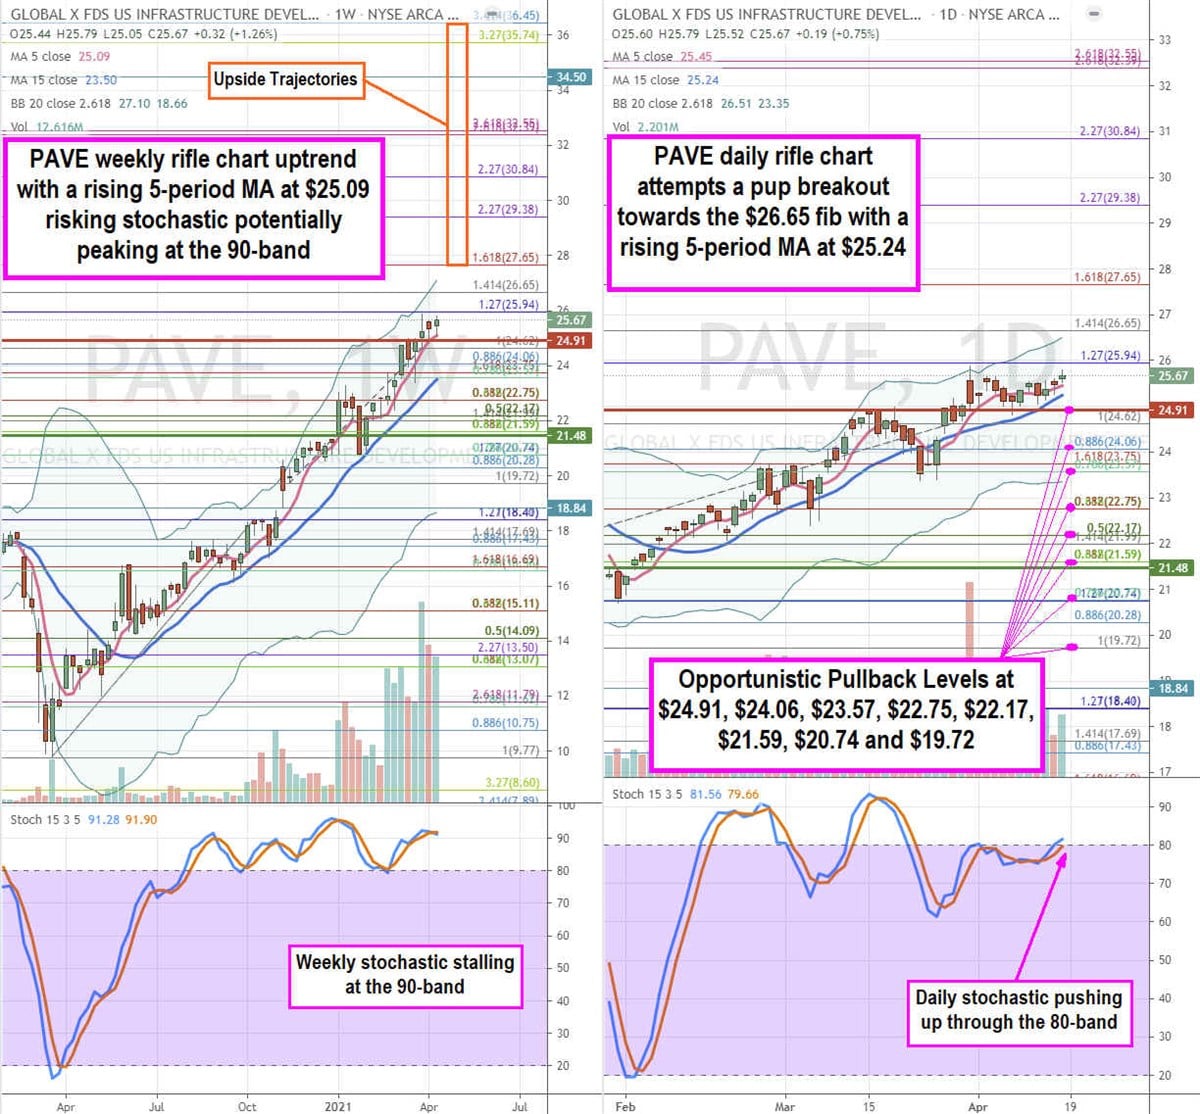
Using the rifle charts on weekly and daily time frames provides a broader view of the landscape for PAVE stock. The weekly rifle chart has a been in an uptrend with a rising 5-period moving average (MA) support at $25.09 as shares peaked at the $25.94 Fibonacci (fib) level. The weekly stochastic is stalling at the 90-band which can indicate a peak in momentum if it crosses down or can trigger another flush higher on a mini pup. The daily rifle chart is attempting a pup breakout as the stochastic crosses up. The daily upper Bollinger Bands (BBs) sit at $26.51, however, the daily market structure high (MSH) sell triggers under $24.91. Prudent investors can watch for opportunistic pullback levels at the $24.91 fib, $24.06 fib, $23.57 fib, $22.75 fib, $22.17 fib, $21.59 fib, $20.74 fib, and the $35.41 fib. Upside trajectories range from the $27.65 fib upwards to the $36.45 fib level.
Before you consider Global X U.S. Infrastructure Development ETF, you'll want to hear this.
MarketBeat keeps track of Wall Street's top-rated and best performing research analysts and the stocks they recommend to their clients on a daily basis. MarketBeat has identified the five stocks that top analysts are quietly whispering to their clients to buy now before the broader market catches on... and Global X U.S. Infrastructure Development ETF wasn't on the list.
While Global X U.S. Infrastructure Development ETF currently has a "hold" rating among analysts, top-rated analysts believe these five stocks are better buys.
View The Five Stocks Here
Wondering when you'll finally be able to invest in SpaceX, StarLink, or The Boring Company? Click the link below to learn when Elon Musk will let these companies finally IPO.
Get This Free Report
Like this article? Share it with a colleague.
Link copied to clipboard.