Deep in the summer trading season, the question is what the second half of 2026 will bring. While fundamental factors suggest upside, the stage also appears set for a correction in the S&P 500 that could shave 20% off its price.
Macroeconomic headwinds and fears of AI spending can keep money on the sidelines, which is about all it will take in the absence of other catalysts.
Market Simmers, Fear Index Poised for a Spike
The Chicago Board of Options Exchange S&P 500 Volatility Index (VIX) is the first chart for investors to watch. Otherwise known as the Fear Index, the VIX is trading near long-term lows. The critical factor, however, is that VIX is set up for a bullish swing that would have bearish implications for the S&P 500. An increase in the VIX, which measures the price of options relative to the underlying index, tends to accompany a decline in the S&P 500.
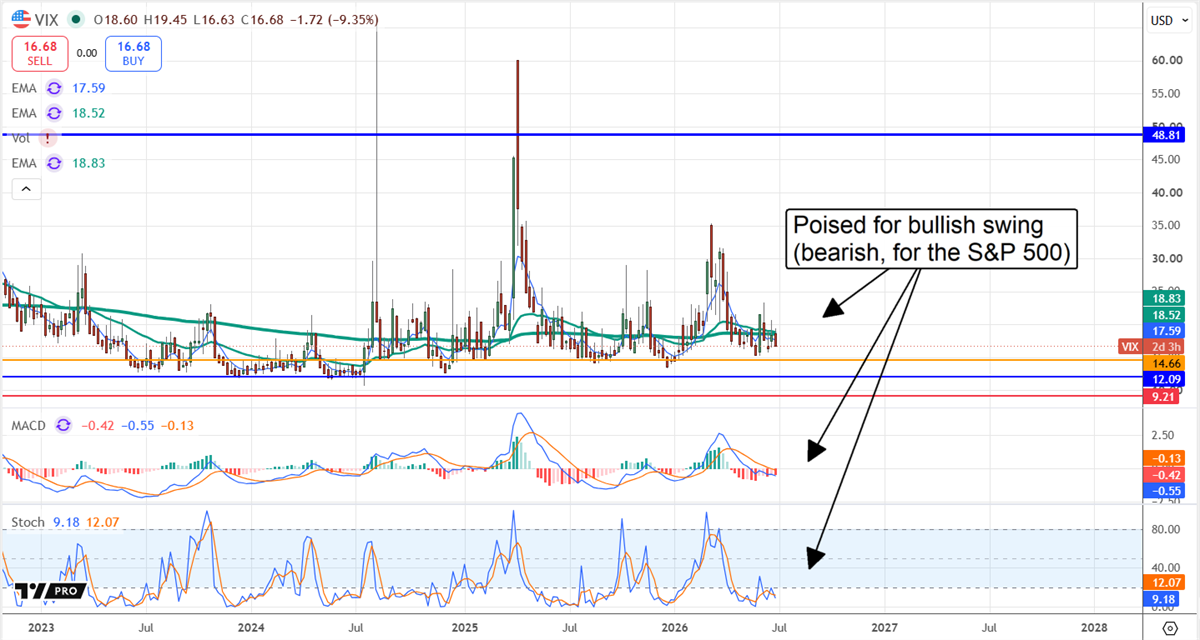
The best-case scenario is that the VIX forms a run-of-the-mill spike, associated with smaller, near-term corrective actions in the S&P 500, and quickly subsides. The worst-case scenario is that this index spikes, retreats, and spikes again, forecasting a major market reversal. As it stands, a major market reversal is not expected. The more likely outcome is that the index forms a run-of-the-mill correction and quickly subsides, allowing the S&P 500 to advance freely.
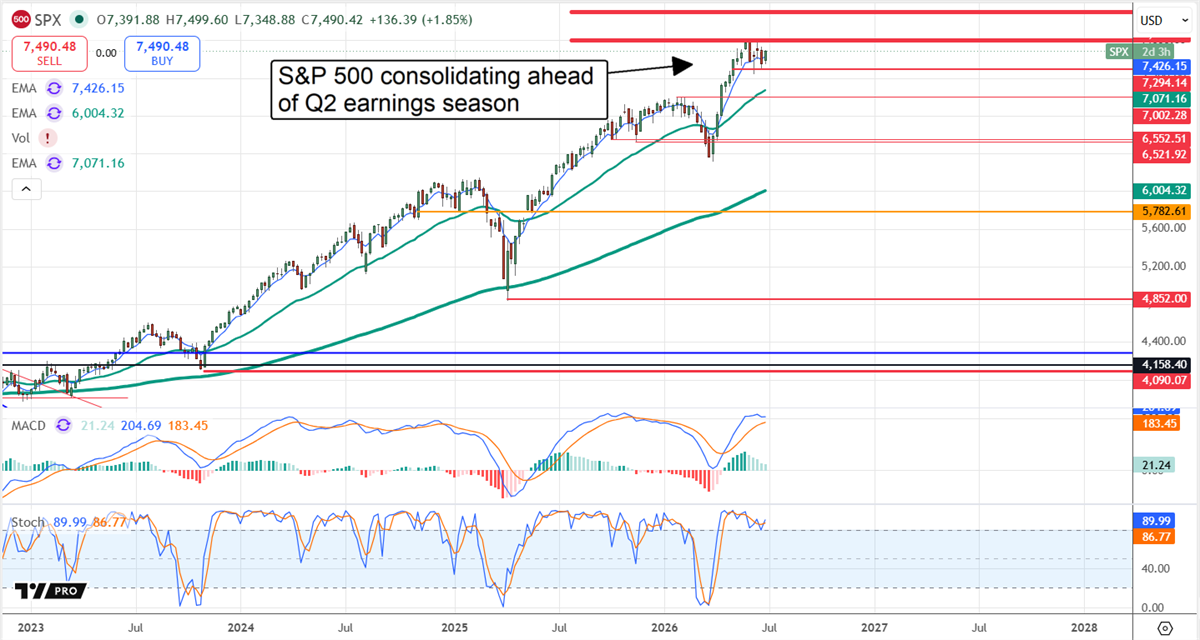
The S&P 500 Is at a Turning Point—Rally On, or Reversal Ahead?
The S&P 500 is the 2nd chart for investors to closely watch this summer. The index has advanced by nearly 18% since April and now needs corrective action. May and June trading has reflected consolidation, but overbought conditions remain in place. The caveat is that overbought conditions can persist indefinitely, given bullish market conditions, and higher highs are still possible—investors can capture them with the S&P 500 ETF NYSEARCA: SPY.
Factors suggesting the market can continue higher include the MACD, which reflects a strong market, and the stochastic, which shows a trend-following buying signal despite its elevated nature. Other factors include the price action, which aligns with a Bullish Flag Pattern. In this scenario, the market needs only a catalyst to advance, and there are catalysts ahead.
Earnings are what drive the S&P 500 today and over the long-term. When earnings growth is present, the index tends to rise, and when it isn’t, it doesn’t. Centered in tech and the AI trade, the earnings outlook is robust, providing a triple-strength tailwind as of mid-2026. Forecasts expect broad market earnings growth this year and next, with acceleration from Q1 to Q2 and from Q2 to Q3, then holding steady at a high double-digit pace in Q4—and estimates continue rising.
Even so, based on Q1 2026 results that outperformed expectations by more than 1,000 basis points, the market still underestimates the AI trade. That sets the stage for the index to outperform in upcoming quarters and for the revision trend to remain positive.
Critical levels for the S&P include the top and bottom of its existing consolidation range. They represent minimum and maximum levels ahead of the expected catalyst, with a break to either side possible. Assuming no change in the earnings outlook, the index will likely advance, moving above 7,600 on its way to 8,000. Technical targets equate to the magnitude of the April-June rally, approximately 1,150 points from the critical breakout point, setting a year-end target of 8,750.
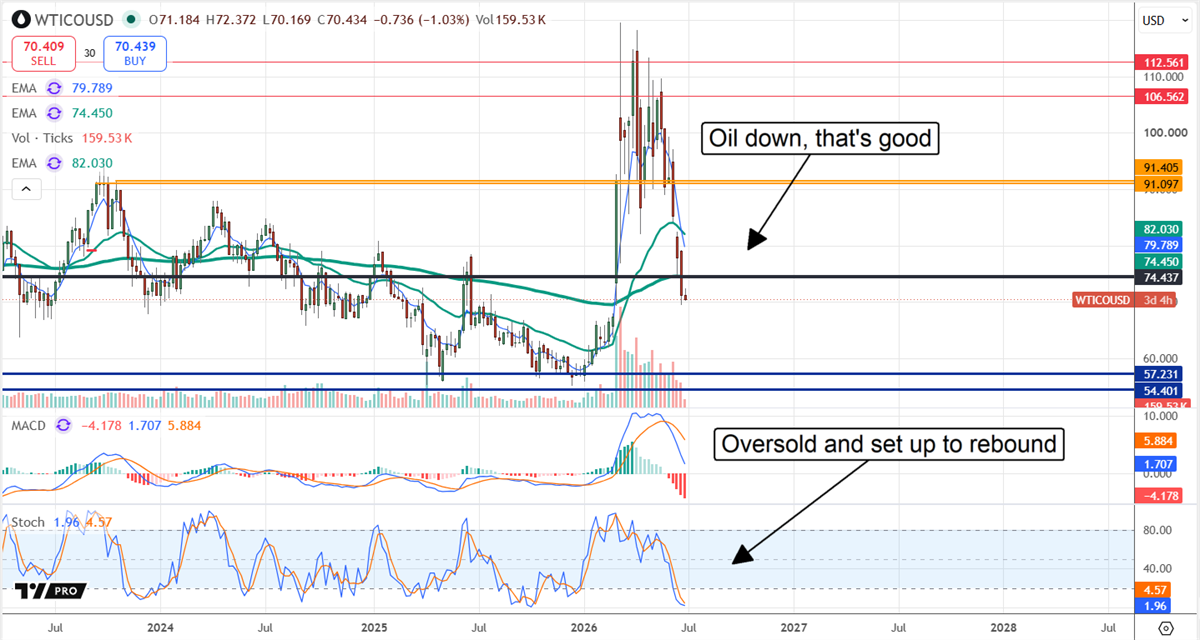
Oil Price Volatility Threatens AI Market
The biggest risk for the S&P 500 is oil, the 3rd chart for investors to watch. WTI is down as of early July but may not stay down long. Although the Strait of Hormuz has reopened, critical infrastructure remains out of service amid declining global stockpiles. Capacity will ramp, but the timing is uncertain, leaving WTI’s price in the balance.
Oil price charts indicate an oversold market; but with a catalyst, it could rebound sharply. In this scenario, high oil prices keep inflation at unwanted levels for longer, increasing the risk of FOMC intervention.
Higher interest rates threaten the AI rally. Rising rates increase the cost of debt, and the AI boom is fueled by debt. Oracle NYSE: ORCL is the poster child, raising its long-term debt to over $120 billion, as of Q3 indications. The Chicago Mercantile Exchange FedWatch Tool reflects an 80% chance for at least one 25 basis point hike by year’s end, and the odds have been rising. The risk is that rising rates slow the pace of new investment and impair what, for some, are already strained cash flows, leading the S&P 500 into a more sustained, potentially long-lasting, correction.
Before you consider SPDR S&P 500 ETF Trust, you'll want to hear this.
MarketBeat keeps track of Wall Street's top-rated and best performing research analysts and the stocks they recommend to their clients on a daily basis. MarketBeat has identified the five stocks that top analysts are quietly whispering to their clients to buy now before the broader market catches on... and SPDR S&P 500 ETF Trust wasn't on the list.
While SPDR S&P 500 ETF Trust currently has a Hold rating among analysts, top-rated analysts believe these five stocks are better buys.
View The Five Stocks Here
MarketBeat just released its list of the 7 hottest IPOs expected to hit Wall Street in 2026. See which companies are preparing to go public and why investors are watching closely.
Get This Free Report