Another month, another potential ceasefire agreement. Iran and the U.S. agreed to temporarily halt military operations in hopes of reaching a deal, sending crude oil prices plummeting at the start of the week. But while a ceasefire can stop fighting in a day, it can’t rebuild lost capacity in a quarter. And with a slew of key energy earnings on deck, the market will soon be forced to price the difference between an oil trade and a refining trade.
Refiners Aren’t Crude Oil Proxies, They’re Claims on Capacity
One mistake investors often make is assuming the entire energy trade rises and falls in tandem with crude oil prices. Exploration and production companies sell crude oil to refiners, who turn it into gasoline, diesel, jet fuel, and other finished products. For the producer, crude oil prices are a revenue line, and the higher they can charge for the raw product, the more profit they’ll retain. But the crude product is a cost line for the refiner, making the relationship between oil prices and downstream companies much more ambiguous.
Prices of WTI and Brent crude usually crowd the headlines, but crack spreads are an even more important metric for downstream oil companies. The crack spread is the difference between what the refiner pays for raw materials and the price at which they sell refined products. If oil prices drop while gasoline or diesel prices stay flat, the spread widens and puts more profit in refiners’ pockets, even if they don’t raise prices.
The most commonly cited crack spread is the 3-2-1 spread, which attempts to measure a refiner’s average yield from turning three barrels of crude oil into two barrels of gas and one barrel of distillate fuel (i.e., heating oil). And as this chart from the U.S. Energy Information Administration (EIA) shows, crude prices and crack spreads don’t always move in the same direction:
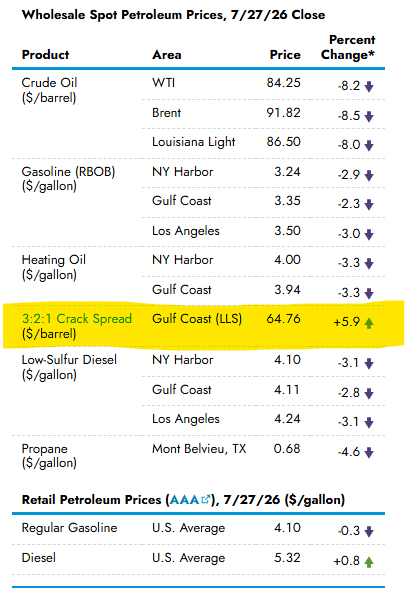
If the price of crude oil drops faster than the price of gasoline and diesel, crack spreads will widen, and refiner profit margins will increase. This distinction is being borne out in the market: the Energy Select Sector SPDR ETF NYSEARCA: XLE has been drastically outperformed by the more targeted VanEck Oil Refiners ETF NYSEARCA: CRAK over the last six months.
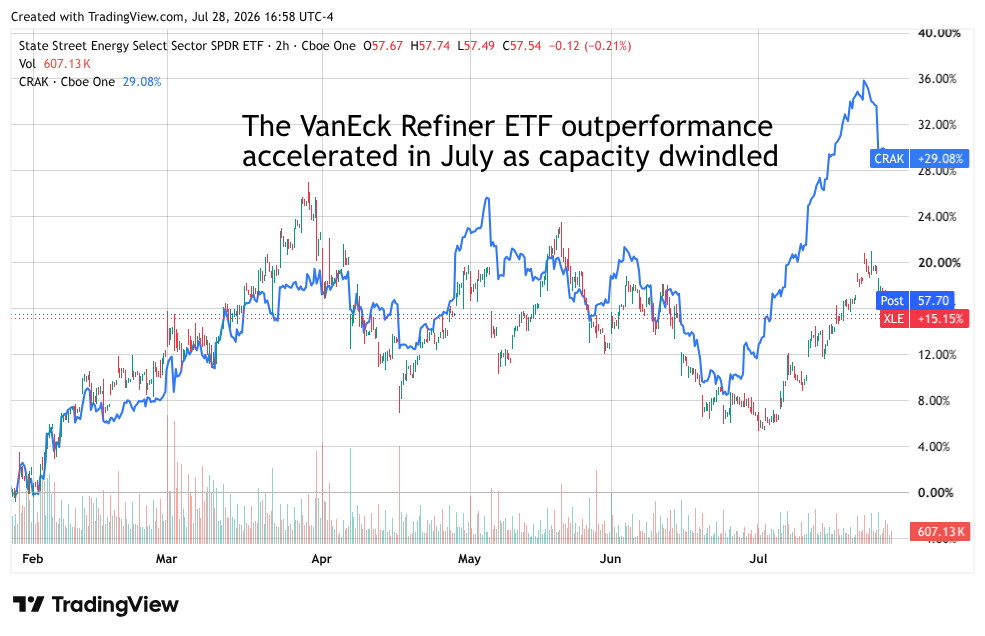
Capacity shortages will outlive any ceasefire, especially when these agreements are tenuous at best. The IEA’s July oil market report highlighted not only four-year highs in refining spreads but also the slowness of refining capacity and exports to return to post-war levels.
Global refinery output was cut by 4.5 million barrels per day (bpd) in Q2 2026, and U.S. inventories are sitting at multiyear lows. Rebuilding 4.5 million barrels of daily output can’t be done via a weekend press release, which is why the Q3 reports from the following three refiners will be crucial for guidance updates.
3 Under-The-Radar Refiners Outperforming Their Larger Peers
Large-cap refiners like Valero Energy Corp. NYSE: VLO and Marathon Petroleum Corp. NYSE: MPC have returned more than 80% year-to-date (YTD), but these gains aren’t leading the refining industry.
Several smaller firms with limited analyst coverage have soared by more than 100% YTD, thanks to varying financial and geographic exposures. Here are three refiners to watch as Q2 earnings reports begin to roll in.
Delek Holdings: Crack Spread Sensitivity Leads to Supersized Returns
Delek US Today
DK
Delek US
$67.71 +0.00 (+0.01%) As of 07/31/2026 03:59 PM Eastern
This is a fair market value price provided by Massive. Learn more. - 52-Week Range
- $19.81
▼
$68.93 - Dividend Yield
- 1.51%
- Price Target
- $51.92
Last-place teams often say, “There’s nowhere to go but up.”This is also the case for
Delek U.S. Holdings Inc. NYSE: DK, a mid-cap refiner running over 300,000 bpd from Texas, Arkansas, and Louisiana. In fiscal 2025, the company lost $23 million on nearly $11 billion in revenue, resulting in an annual earnings-per-share (EPS) loss of 38 cents.
This switch finally flipped in Q1 this year, when the company posted EPS of 8 cents versus an expected loss of $1.42, a massive turnaround despite flat year-over-year (YOY) revenue. Net crack gains were the primary driver of profit. The company earned a net crack of $10.17 per barrel of crude oil (bbl) from Q2 2024 through Q1 2025; it grew to $14.62 per bbl from Q2 2025 through Q1 2026, boosting refining margins from $1.96 to $7.53 while operating expenses increased by just under 5% in the same period.
Q2 2026 earnings are scheduled for Aug. 5, and the market will be looking to see if the company boosts its full-year throughput and free cash flow projections.
PBF Energy: Locations Near Isolated Supply Routes Boost Earnings Potential
PBF Energy Today
$72.13 -0.97 (-1.33%) As of 07/31/2026 03:59 PM Eastern
This is a fair market value price provided by Massive. Learn more. - 52-Week Range
- $21.24
▼
$74.74 - Dividend Yield
- 1.53%
- P/E Ratio
- 6.38
- Price Target
- $46.31
benefits from its convenient refining locations, giving it proximity to some of the country’s hardest-to-supply areas. The company’s operations span from Delaware and New Jersey to Louisiana to California, linking it to both East Coast Brent and the supply-starved West Coast with a processing capacity of over 900,000 bpd.
Though the Q1 numbers were weak (including a larger-than-expected loss of 88 cents per share), the company received three price target increases in the last few weeks, including a new Street-high $71 from Goldman Sachs.
Despite a 125% YTD return, the stock is still cheap compared to its peers at 5.5 times forward earnings and 0.24 times sales. PBF is the next refiner to report Q2 results, with a conference call scheduled for July 30. The big news investors will be watching is an update on the timing of the Martinez recovery and the amount of realized capture the company receives against the benchmark spread.
Par Pacific: Access to Strapped Asian Markets Offers Profitability Beyond Peers
Par Pacific Today
$85.87 -0.04 (-0.05%) As of 07/31/2026 03:59 PM Eastern
This is a fair market value price provided by Massive. Learn more. - 52-Week Range
- $26.83
▼
$87.03 - P/E Ratio
- 9.11
- Price Target
- $81.57
If PBF Energy has good locations for its refineries,
Par Pacific Holdings Inc. NYSE: PARR has the top-floor penthouse in the center of town. The company has the smallest capacity of our three stocks at just under 220,000 bpd. Still, its footprint is in Hawaii, the Rockies, and the Pacific Northwest, giving it easy access to West Coast markets and the struggling Asian market.
Asian oil markets are dependent on Persian Gulf flows due to reduced Russian capacity and the lack of domestic supply. But with the Asian supply now being pulled toward Europe, the import market for Par Pacific products has risen swiftly.
The company missed EPS and beat revenue in Q1 2026, but the EPS miss still turned a 94-cent-per-share loss in Q1 2025 into an 78-cent-per-share gain in Q1 2026. Revenue also grew 4.5% YOY, and management signaled strength to investors by repurchasing $28 million of stock during the period.
Only 13 analysts cover the stock, but 11 rate it a Buy, resulting in a Moderate Buy consensus rating and an average price target of $81.57. However, the most recent price target updates from Goldman Sachs and TD Cowen are $92 and $100, representing respective upsides of 13% and 20% from current levels.
Before you consider Par Pacific, you'll want to hear this.
MarketBeat keeps track of Wall Street's top-rated and best performing research analysts and the stocks they recommend to their clients on a daily basis. MarketBeat has identified the five stocks that top analysts are quietly whispering to their clients to buy now before the broader market catches on... and Par Pacific wasn't on the list.
While Par Pacific currently has a Moderate Buy rating among analysts, top-rated analysts believe these five stocks are better buys.
View The Five Stocks Here
MarketBeat just released its list of the 7 hottest IPOs expected to hit Wall Street in 2026. See which companies are preparing to go public and why investors are watching closely.
Get This Free Report
