The retail sector was one of the biggest winners in earnings season, which was especially evident in some of the reports that rolled in last week. Eight major retailers reported earnings within 48 hours, and nearly all beat on headline numbers. But headline numbers rarely tell the story, and this quarter was especially deceiving. Tariff refunds have done to earnings what steroids did to baseball players in the 1990s, and these juiced results can mask underlying weakness.
Take Abercrombie and Fitch Co. NYSE: ANF, for example, which soared more than 35% after its Q2 release on an impressive double beat and buyback increase. But the company accumulated about $100 million in tariff refunds during the period, boosting margin by 790 basis points (bps) and adding $1.75 to the $4.12 earnings per share (EPS) figure. Another $20 million in refunds is expected in Q3, but comps were weak, especially at Hollister.
To find the real winners, we need to screen out earnings juiced by tariff refunds. That means focusing on comp sales and traffic instead of EPS and revenue, and parsing true operational improvement from one-time windfalls.
Dollar General: The Trade Down King Continues to Grow Traffic
Cash-strapped consumers trading down to discount stores has been a boon to Dollar General Corp. NYSE: DG, which seems to impress the market every time a conference call rolls around.
Dollar General Today
DG
Dollar General
$122.57 -3.32 (-2.64%) As of 08/28/2026 03:58 PM Eastern
- 52-Week Range
- $95.11
▼
$158.23 - Dividend Yield
- 1.93%
- P/E Ratio
- 15.94
- Price Target
- $134.65
In fiscal Q2 2027 results released Aug. 27, the company once again beat top- and bottom-line estimates, with same-store sales (i.e., comps) up 3.5% and growth spread out across all four merchandise categories.
Foot traffic was up for a fifth consecutive quarter, and gross margins expanded by 127 bps.
Crucially, the EPS beat wasn’t reliant on tariff refunds. The company earned $2.48 per share in the period, and management estimates that only 25 cents of that figure came from tariff refunds.
Removing the one-time tariff boost leaves EPS of $2.23 per share, still well above the expected $2.01 and nearly 17% higher than fiscal Q2 2026’s number of $1.86. Management also raised full-year guidance on revenue, comps, and EPS.
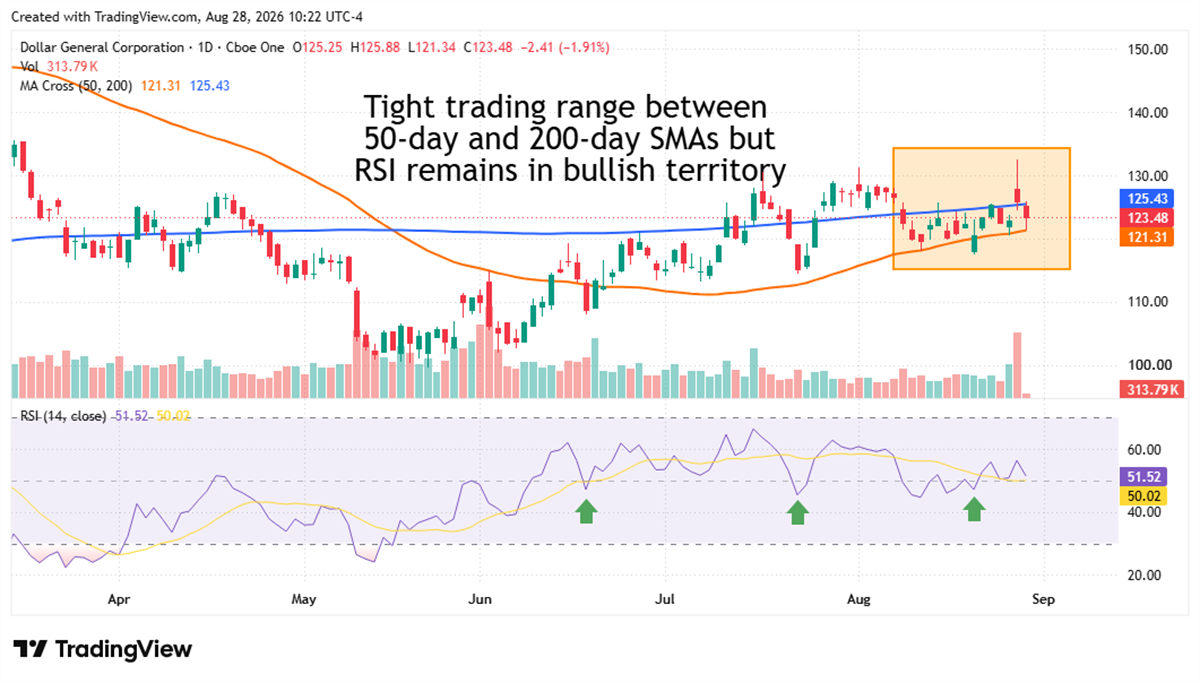
DG shares jumped as much as 12% following the earnings call before surrendering most of those gains later in the day. But the bounce off the May lows is confirmed, and the Relative Strength Index (RSI) refuses to dip much below 50. The stock is up 16% in the last three months, and a potential Golden Cross on the 50-day and 200-day moving averages could be the next technical catalyst.
Best Buy: Stock Sell-off Obscures High-Quality Beat
Best Buy Co. Inc. NYSE: BBY posted one of the better quarters in the retail sector but fell 4% after the release, despite only $34 million in tariff refunds.
Best Buy Today
$82.34 -1.22 (-1.46%) As of 08/28/2026 03:58 PM Eastern
- 52-Week Range
- $55.10
▼
$91.26 - Dividend Yield
- 4.66%
- P/E Ratio
- 13.70
- Price Target
- $85.40
High memory costs continue to weigh heavily on computing prices, and management expects this tension to persist through year-end. But Best Buy’s fiscal Q2 2027 results deserve a closer look, since the beat was the cleanest in the cohort.
EPS and revenue both easily beat expectations, but the eye-popping number was comps, which grew 4.1% year-over-year (YOY) versus management’s expectation of 1%. Despite soaring memory costs, computing and home theater product sales continued to grow, indicating that consumers are still willing to pay up for big-ticket home entertainment.
Management lifted full-year comp sales guidance to a 1.9% to 3% range, and EPS to $6.70 to $6.90.
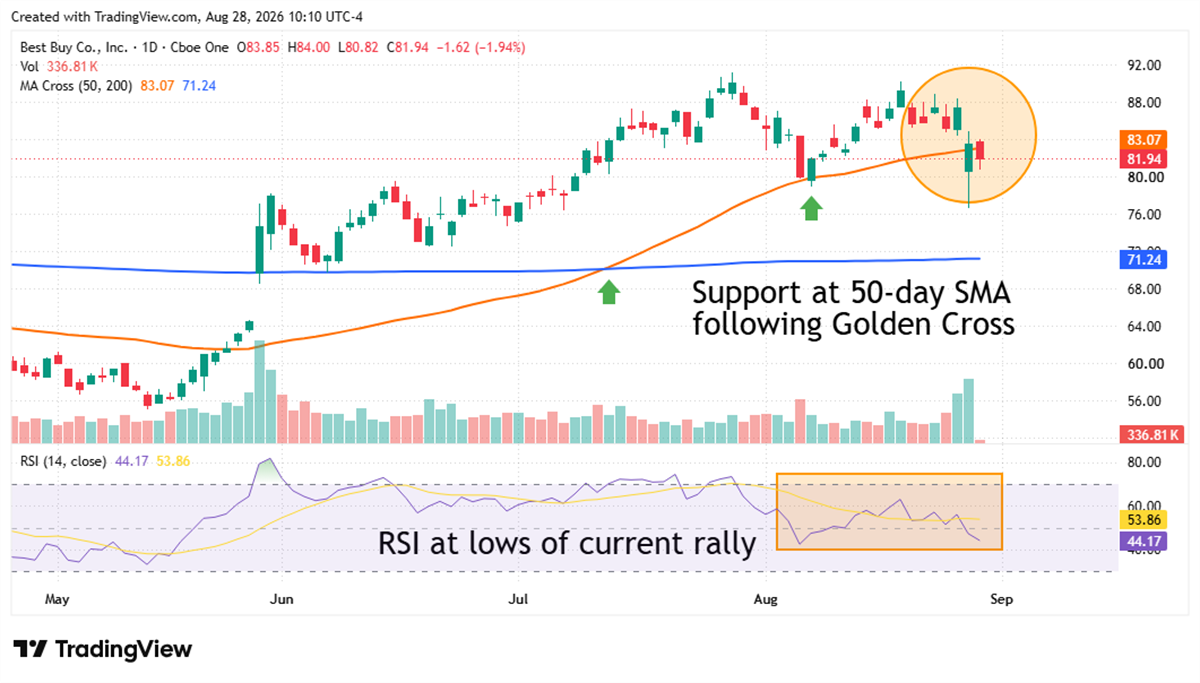
BBY shares were up nearly 30% year-to-date (YTD) before earnings, so investors may have been looking for reasons in the report to hit the cash register. But this could be an opportunity for new investors to ride some technical and fundamental tailwinds. The stock is bumping up against its 50-day moving average, which has been a support area since the Golden Cross formed in July, and the RSI is back to its August lows.
Williams-Sonoma: Outlier in Weakest Consumer Category
Few areas of the retail sector have seen more divergent consumer attitudes than the home furnishings industry.
Williams-Sonoma Today
WSM
Williams-Sonoma
$235.07 -3.33 (-1.40%) As of 08/28/2026 03:58 PM Eastern
- 52-Week Range
- $165.51
▼
$254.89 - Dividend Yield
- 1.29%
- P/E Ratio
- 24.06
- Price Target
- $244.44
According to the most recent Census Bureau Retail Sales report, furniture and home furnishing sales in 2026 fell 1.7% from the same 7-month period last year. But not every home goods store is feeling the heat. The K-shaped economy is alive and well in this space, and Williams-Sonoma Inc. NYSE: WSM continues to grow comps while many competitors struggle.
Williams-Sonoma reported fiscal Q2 2026 results on Aug. 26, and (of course), beat EPS and revenue estimates. But two numbers stand out in the report.
First, comp sales grew 6.2% YOY, accelerating considerably above Q1’s 4.8% number. With furniture sales basically flat in 2026, comp growth of this magnitude shows Williams-Sonoma is taking massive share from competitors struggling to get traffic in the door. Second, management raised full-year operating margin guidance to 17.8% to 18% and said it did not factor in any tariff refunds, implying operational efficiency gains will do the heavy lifting.
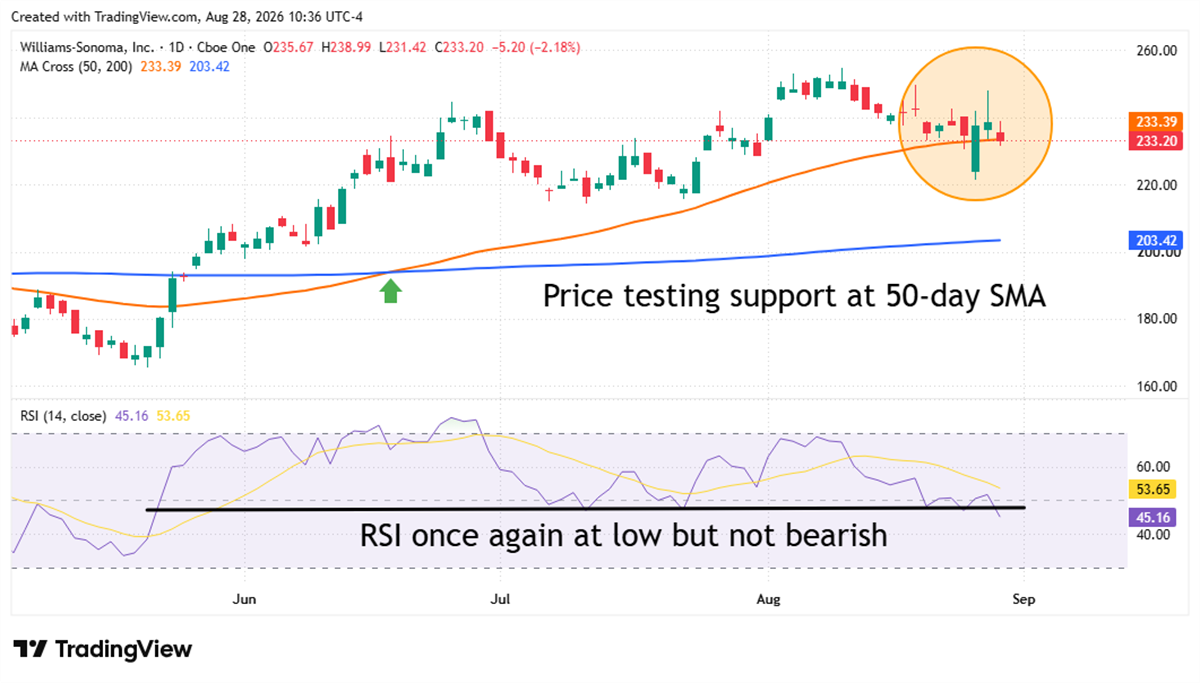
The WSM chart has a similar setup to BBY, with investors taking profits following an excellent quarter and a YTD run-up of over 30%. But the Golden Cross hints that the uptrend will take more than a little profit-taking to break, and the 50-day SMA could be another entry opportunity for new investors. The RSI is teetering near 50, but still hasn’t submerged into the bearish zone underneath.

Continue following MarketBeat
Add MarketBeat as your preferred source on Google to see our latest stories in your feed.
Before you consider Dollar General, you'll want to hear this.
MarketBeat keeps track of Wall Street's top-rated and best performing research analysts and the stocks they recommend to their clients on a daily basis. MarketBeat has identified the five stocks that top analysts are quietly whispering to their clients to buy now before the broader market catches on... and Dollar General wasn't on the list.
While Dollar General currently has a Hold rating among analysts, top-rated analysts believe these five stocks are better buys.
View The Five Stocks Here
Discover the 10 Best High-Yield Dividend Stocks for 2026 and secure reliable income in uncertain markets. Download the report now to identify top dividend payers and avoid common yield traps.
Get This Free Report
